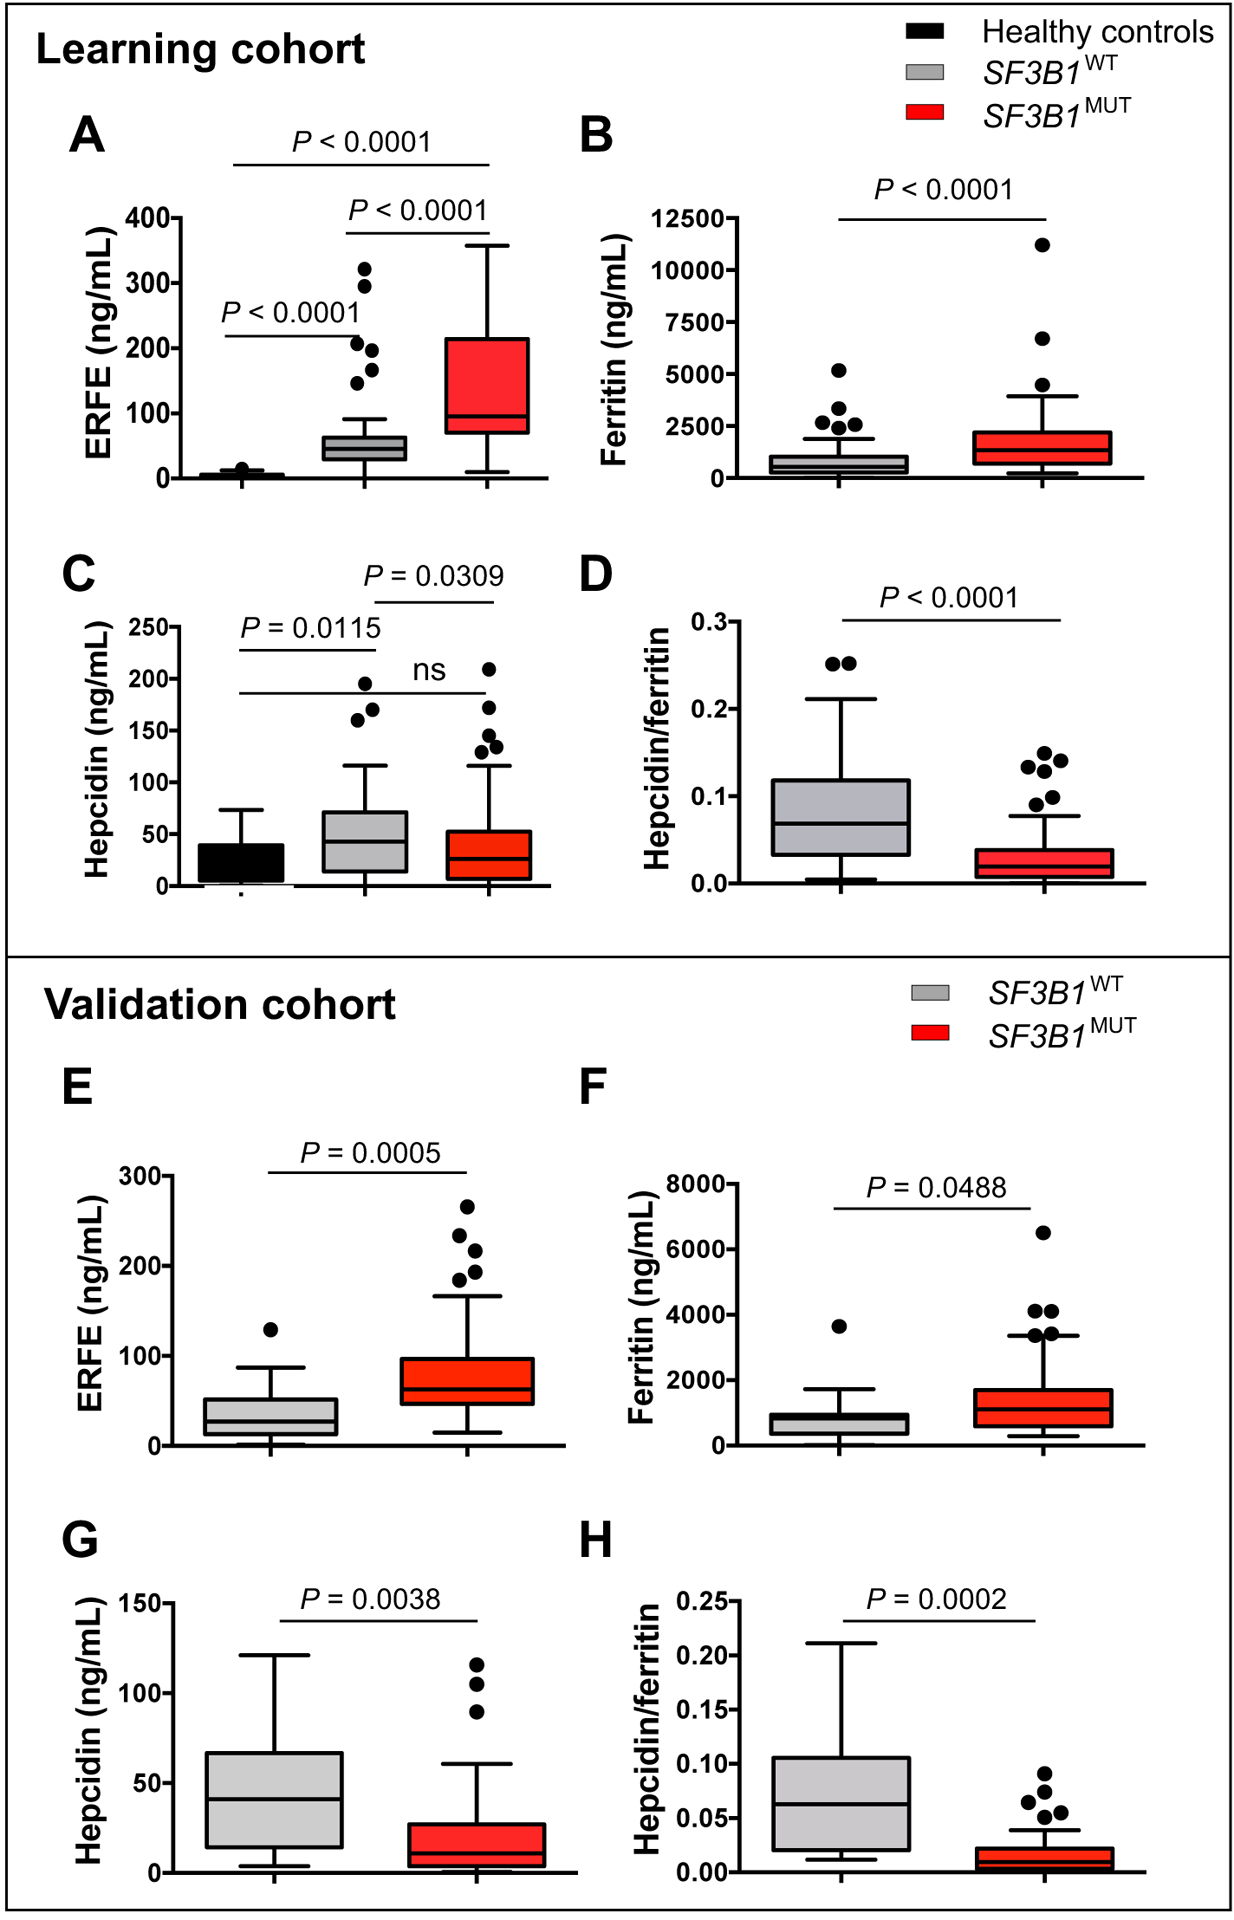
Fig. 5: Increased plasma concentration of ERFE in SF3B1MUT MDS patients.

Quantitative analysis was performed in plasmas collected from 20 non-blood donor healthy volunteers (black), 156 patients with MDS including 94 SF3B1MUT (red) and 62 SF3B1WT (gray) representing the training cohort (A-D), and 55 patients with MDS including 42 SF3B1MUT (red) and 13 SF3B1WT (gray) representing the validation cohort (E-H). The graphs show quantification of erythroferrone (A, E), ferritin (B, F), hepcidin (C, G), and hepcidin/ferritin ratio (D, H). Results are expressed as medians and interquartile ranges (IQRs). The boxplots represent the median and the first and third quartiles, and the whiskers represent the lowest and the highest values still within the 1.5 IQR of the lower and upper quartiles. Mann-Whitney for P-values.
