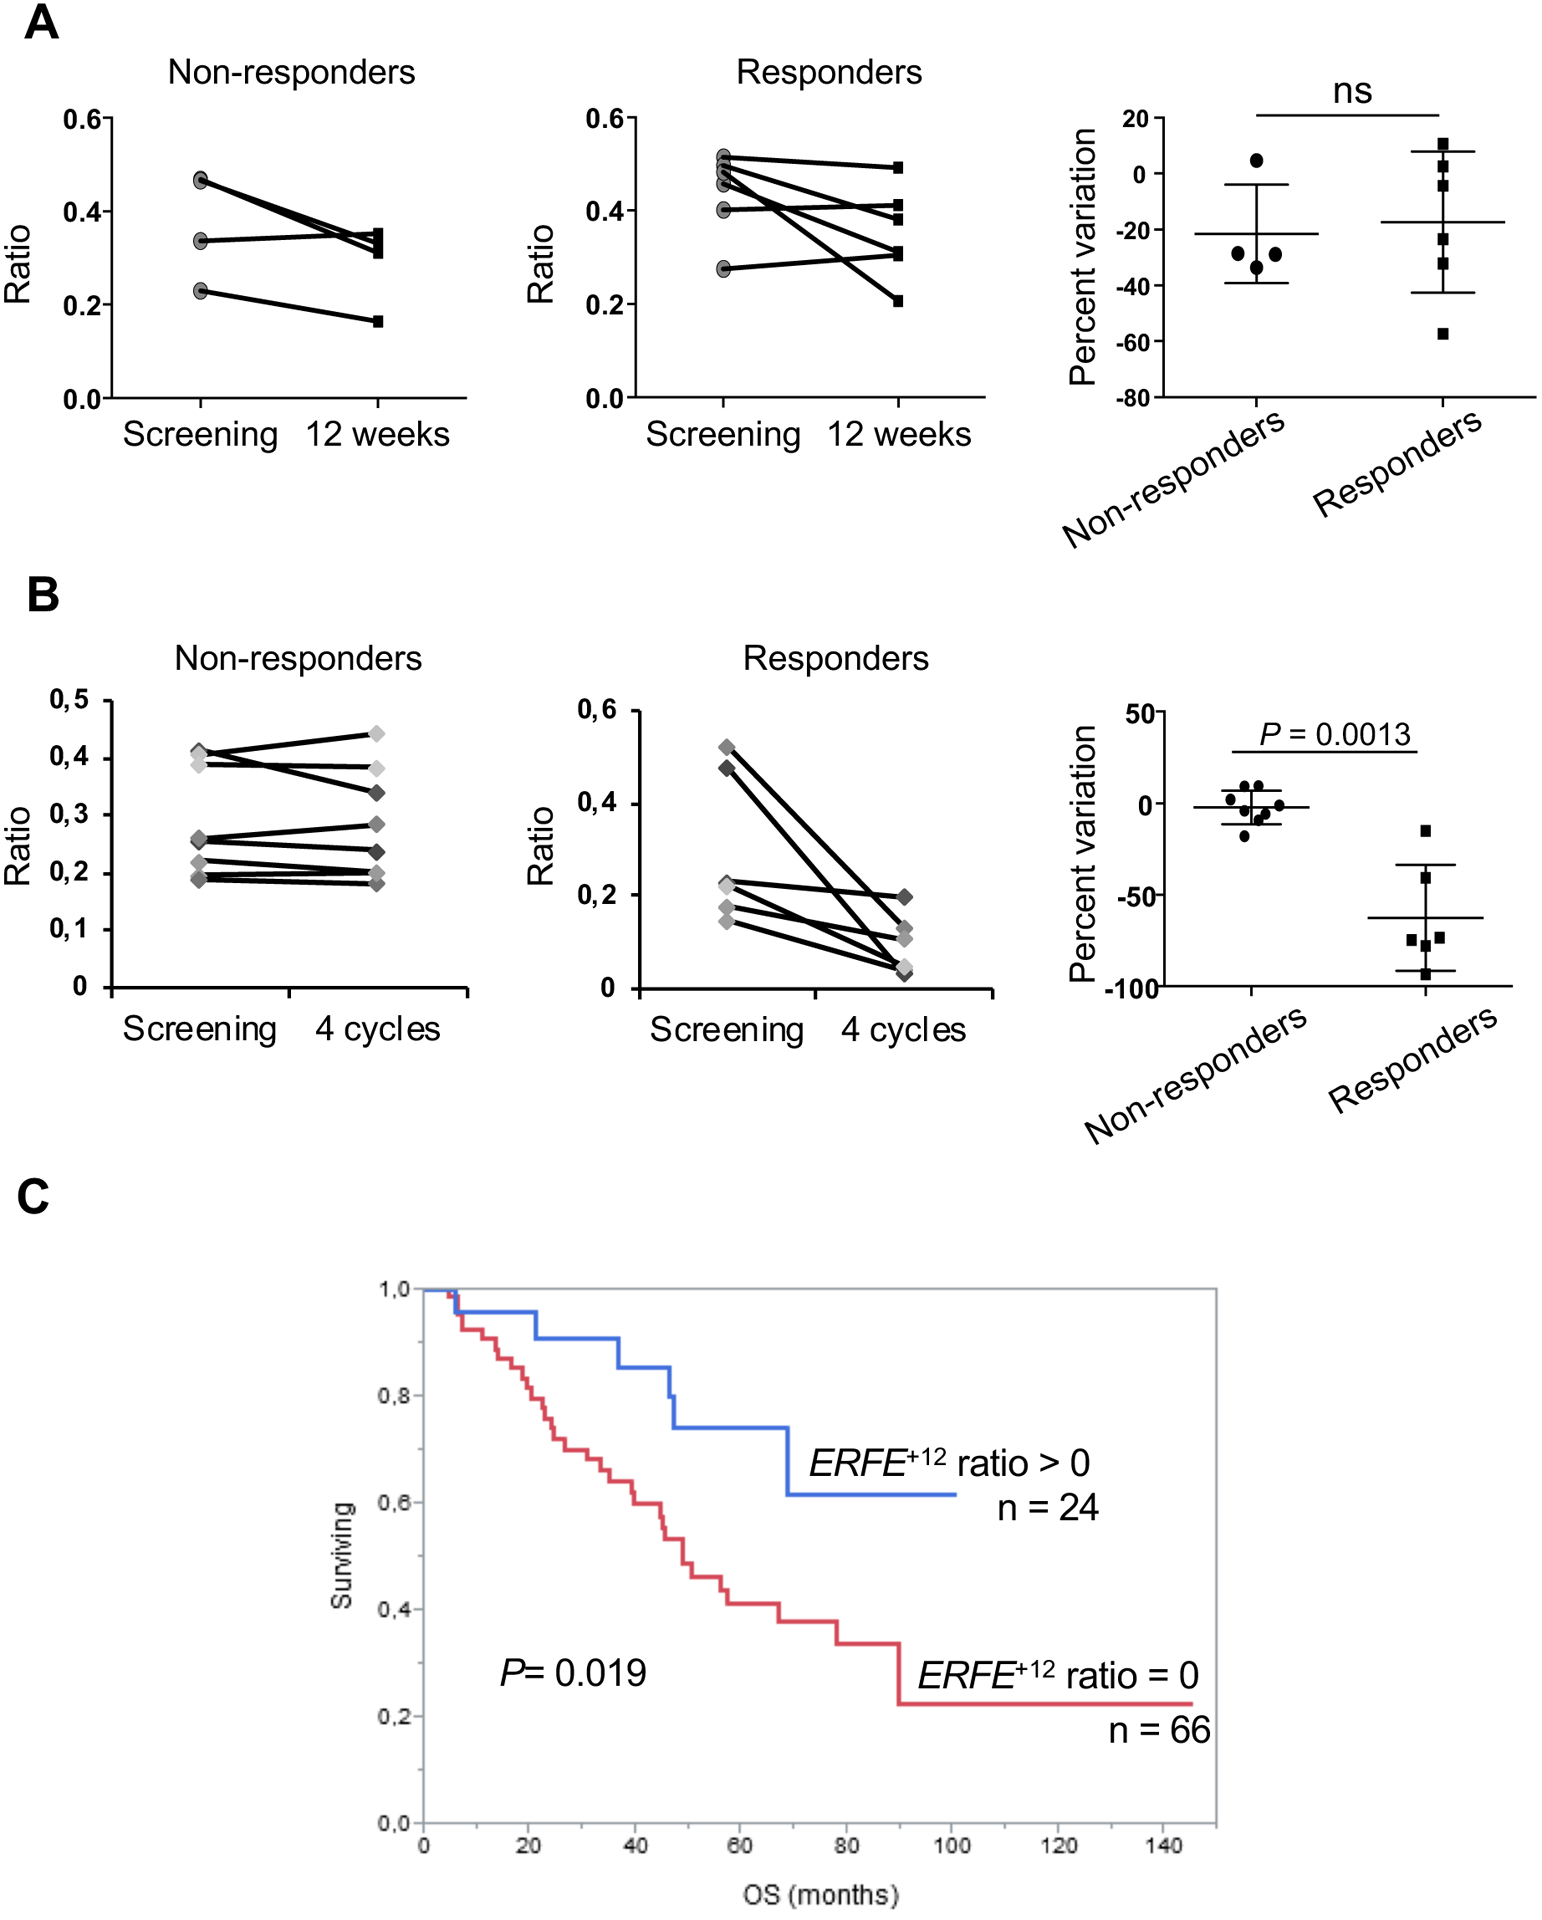
Fig. 7: ERFE+12 expression as a marker of clonal erythropoiesis and survival.

Fluorescent PCR was performed at screening and evaluation in (A) 10 paired samples from SF3B1MUT MDS patients enrolled in the GFM-Retacrit-2013 clinical trial (4 non-responding and 6 responding patients) and (B) 14 paired samples from patients with SF3B1MUT MDS enrolled in the GFM-LenEpo-2008 clinical trial (8 non-responding and 6 responding patients). Peak heights of ERFE+12 and ERFEWT signals were integrated as ERFE+12/ERFE+12+ERFEWT ratios. Percent variations of ratios are indicated (right) as medians and IQR (25 – 75%). Mann-Whitney test for P-values. (C) Overall survival according to ERFE+12/ERFE+12+ERFEWT ratio shown as a Kaplan-Meier curve. A threshold of positivity of 0.008 was determined by ROC analysis. Log-Rank test for P-value. ns: not significant.
