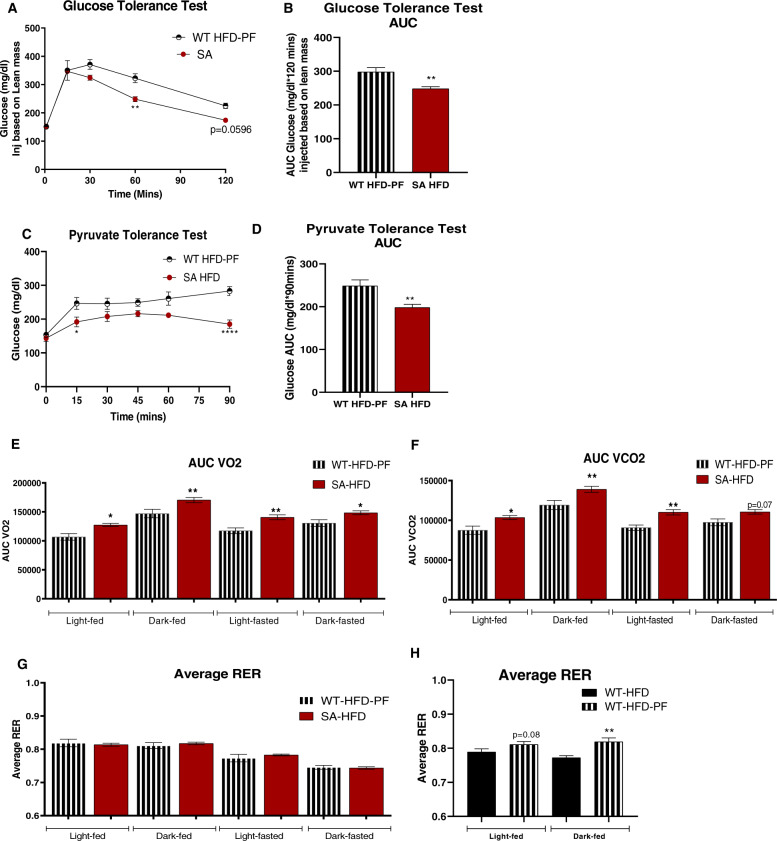
Fig. 6. Attenuating body weight gain on HFD does not affect metabolic capacity of wild-type mice compared to SA knock-in mice.
A Glucose tolerance test excursion curve and B area under curve for glucose tolerance after 6 weeks of pair-feeding. C Pyruvate tolerance excursion curve and D area under curve for pyruvate tolerance after 6 weeks of pair-feeding. Data are presented as means ± SEM (WT-HFD-PF n = 9, SA-HFD n = 10; *p < 0.05, **p < 0.01, ****p < 0.0001 vs WT-HFD-PF). E Volume of O2 consumption; F volume of CO2 production; G, H respiratory exchange ratio of mice measured using CLAMS Monitoring system after 6 weeks of pair feeding [27]. Data are presented as means ± SEM WT-HFD n = 5, WT-HFD-PF n = 9, SA-HFD n = 10; *p < 0.05, **p < 0.01 vs WT-HFD-PF (E–G) and vs WT-HFD (H).

