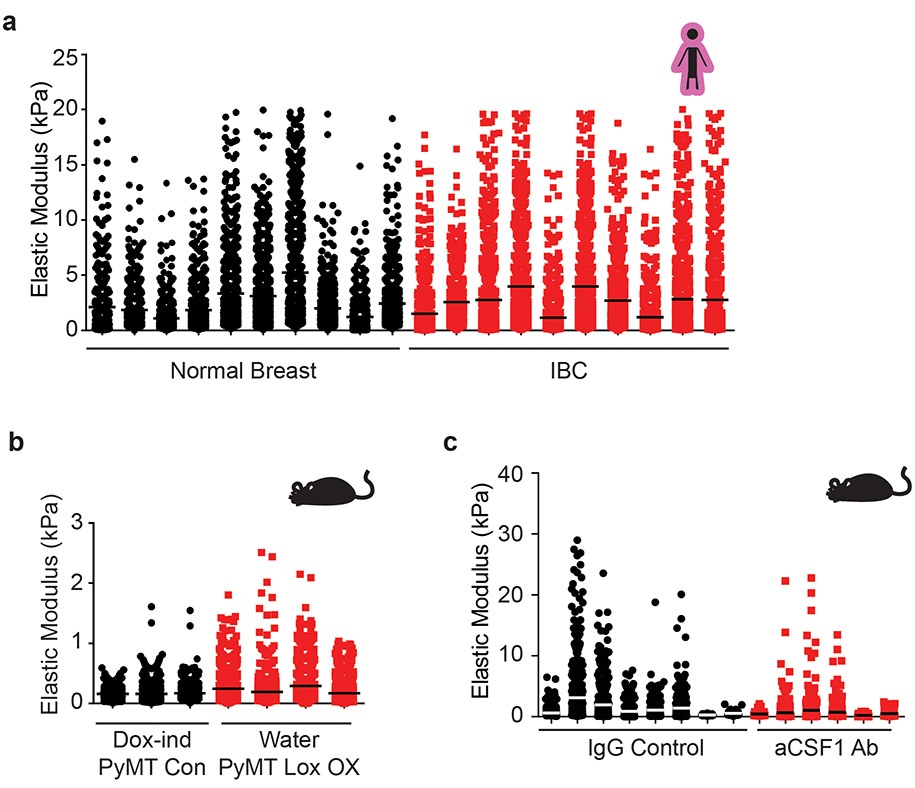
Extended Data Figure 8: ECM Stiffness for individual specimens.
(a) Scatter plot showing mean and individual values of atomic force microscopy (AFM) microindentation measurements of individual human samples categorized as normal breast tissue (black circles) or invasive ductal carcinoma (IDC; red squares). (b) Scatter plot showing mean and individual values of AFM microindentation measurements of individual mouse mammary tumors from doxycycline treated MMTV-PyMT+/−; Col1a1-tTA+/−; TetO-mLox control mice (DOX-ind PyMT Con; black circles) or water treated mice overexpressing stromal Lox (Water PyMT Lox OX; red squares). (c) Scatter plot showing mean and individual values of AFM microindentation measurements of individual mouse mammary gland tumors from 8-week-old IgG1 treated (IgG Control; red squares) and anti-CSF1 treated (aCSF1 Ab; black circles) PyMT tumors.

