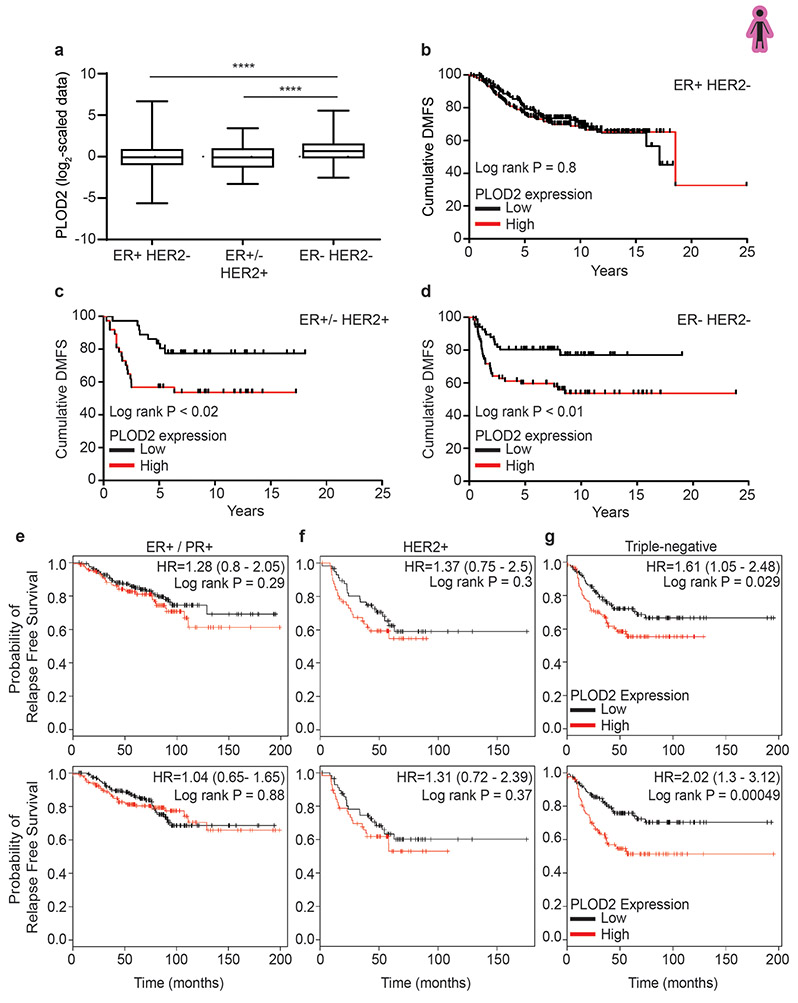
Extended Data Figure 9: PLOD2 correlations with distant metastasis free survival and probability of relapse free survival.
(a) Log2 scaled data graphs showing relative PLOD2 gene expression levels in patients stratified by estrogen and epidermal growth factor receptor two (ER/HER2) status (ER+ HER2− n=314; ER− or + /HER2+ n=73; ER−/HER2− n=133). Whiskers denote minima and maxima, box denotes 25th and 75th percentiles and median. Statistical analysis was performed to compare PLOD2 expression levels among subtypes using Kruskal-Wallis one-way ANOVA (****p < 0.0001) and two-tailed Mann-Whitney U test without adjustment for multiple comparisons for individual comparisons (****p < 0.0001). (b) Line graphs showing distant metastasis-free survival (DMFS) for patients with estrogen receptor positive and epidermal growth factor receptor two negative breast tumors (ER+/− HER2−; low n=157 & high=157). (c) Line graph of DMFS for patients with estrogen receptor negative or negative and epidermal growth factor receptor two positive breast tumors (ER− or +/HER2+; low n=36 & high=37). (d) Line graph of DMFS for patients with estrogen receptor negative epidermal growth factor receptor negative breast tumors (ER− HER2−; low n=66 & high=67). Statistical analyses were performed to compare PLOD2 and DMFS for each subtype or Log-rank (Mantel-Cox) test (b) p = 0.8051 (c) *p = 0.0144 (d) p = **0.0050. (e-g) Kaplan-Meier curves indicating the probability of relapse-free survival assessed in ER+/PR+ (e), HER2+ (f), and triple negative (g) breast cancer patients up to 16 years after diagnosis. A correlation between PLOD2 (gene encoding LH2) expression and RFS has been determined using an online tool (http://kmplot.com/analysis/) as described in the methods. Top and bottom panels represent two distinct Affymetrix PLOD2 probes (202619 and 202620) from the same database. For Kaplan-Meier curves, statistical analyses were performed using LogRank test.

