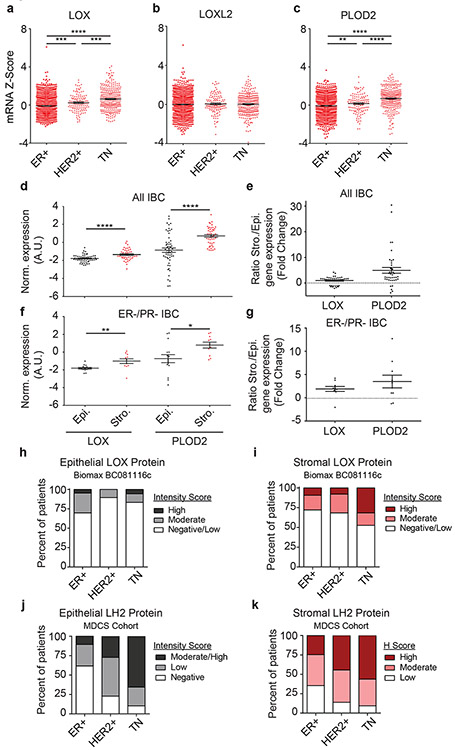
Figure 2: LOX and PLOD2 are enriched in TNBC and predominantly expressed by stromal cells.
(a-c) Gene expression analysis of LOX (a), LOXL2 (b), and PLOD2 (c) stratified by ER+ (n = 1355), HER2+ (n = 127), and triple negative (TN; n = 299) subtypes. Gene expression is plotted as a scatter plot of mRNA z scores with the mean ± SEM. Statistical analysis was performed using one-way ANOVA for overall analysis and two-tailed unpaired t-test without adjustment for multiple comparisons was used for individual comparisons. (a) Overall ****p < 0.0001, ER+-HER2+ ***p = 0.0001, ER+-TN ****p < 0.0001, HER2+-TN ***p = 0.0008. (b) Overall p = 0.7984, ER+-HER2+ p = 0.5435, ER+-TN p = 0.7198, HER2+-TN p = 0.7505. (c) Overall ****p < 0.0001, ER+-HER2+ **p = 0.01, ER+-TN ****p < 0.0001, HER2+-TN ****p < 0.0001. (d) Scatter plot of individual and mean values ± SEM comparing LOX (n = 47) and PLOD2 (n = 57) gene expression in microdissected epithelial and stromal compartments of human invasive breast carcinomas. Statistical analysis was performed using two-tailed Mann-Whitney U test ****p < 0.0001. (e) Scatter plot of individual and mean values ± SEM of LOX and PLOD2 gene expression fold change from (d) in stromal cells relative to epithelial cells. (f-g) Restriction of the stromal/epithelial gene expression analysis in (d) and (e) to estrogen receptor (ER) negative and progesterone receptor (PR) negative samples. (LOX n = 11, PLOD2 n = 15). Statistical analysis was performed using two-tailed Mann-Whitney U test **p = 0.002, *p = 0.0204. (h) Bar plot showing distribution of epithelial LOX staining intensity among human patient tumors stratified by molecular subtype. (i) Bar plot showing distribution of stromal LOX staining intensity among human patient tumors stratified by molecular subtype. LOX scoring of Biomax BC081116c TMA was performed by a researcher (ER+ n = 43, HER2+ n = 38, TN n = 18 epithelial, 19 stromal). (j) Bar plot showing distribution of epithelial LH2 staining intensity among human patient tumors stratified by molecular subtype. (k) Bar plot showing distribution of stromal LH2 H Score among human patient tumors stratified by molecular subtype. LH2 scoring of patient samples from the MDCS cohort was performed by a pathologist. See Supplementary Tables 2 and 3 for patient information. All n values represent biologically independent human tissue specimens.

