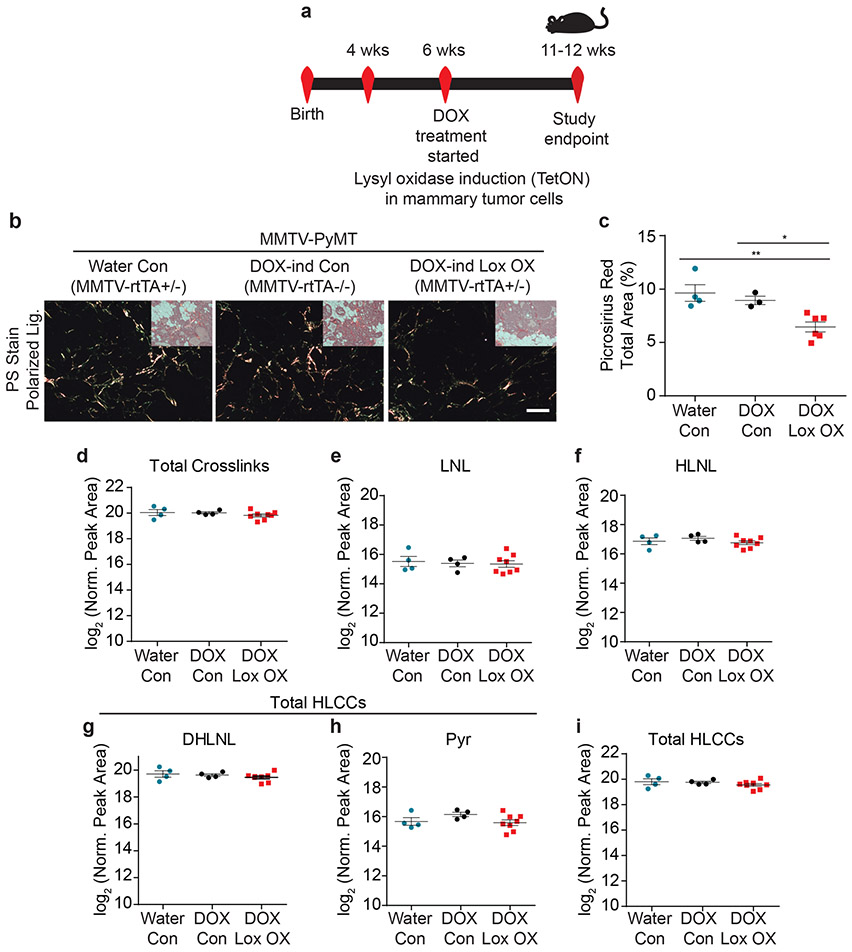
Figure 3: Epithelial-derived collagen crosslinking enzymes fail to induce collagen crosslinking.
(a) Schematic depicting the experimental strategy used to induce epithelial Lox overexpression. (b) Polarized light images with brightfield inset of picrosirius red stained murine mammary tissues. Scale bar is 100 μm. (c) Scatter plot showing mean ± SEM of percent area of picrosirius red staining per field of view in PyMT controls (Water n = 4, DOX n = 3) and PyMT epithelial Lox overexpression (n = 6). Statistical analysis was performed using Kruskal-Wallis one-way ANOVA *p = 0.010 and two-tailed Mann-Whitney U-test without adjustment for multiple comparisons for individual comparisons **p = 0.0095, *p = 0.0238. (d) Scatter plot showing individual and mean values ± SEM of total tissue collagen crosslinks in PyMT controls (Water n = 4, DOX n = 4) and PyMT epithelial Lox overexpression (n = 8). (e-h) Scatter plots showing individual and mean values ± SEM for each LCC and HLCC collagen crosslink measured in PyMT control (Water n = 4, DOX n = 4) and PyMT epithelial Lox overexpression (n = 8) tumor tissue. (i) Scatter plot showing individual and mean values ± SEM of total HLCCs. Statistical analyses for crosslinking data were performed using one-way ANOVA for overall comparison and unpaired t-test without adjustment for multiple comparisons for individual comparisons. (d) Overall p = 0.8077. (e) Overall p = 0.899. (f) Overall p = 0.4286. (g) Overall p = 0.4586. (h) Overall p = 0.2128. (i) Overall p = 0.4325. All n values represent biologically independent mouse tissue specimens.

