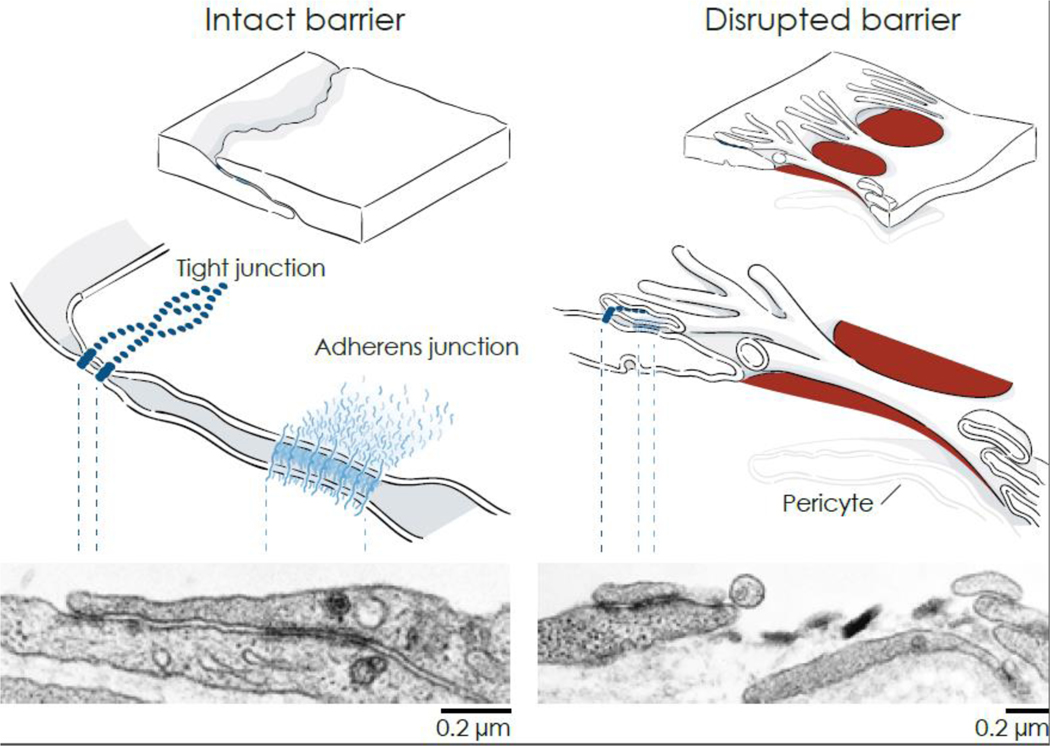
Figure 2. Comparison of endothelial junctions at intact and disrupted barriers.
Left: Drawings of the border of normal overlapping endothelial cells (upper) showing the relative locations of the tight junction and adherens junction (middle). Corresponding transmission electron micrograph (TEM) of a normal venule showing overlapping endothelial cell borders with electron-dense junctions and underlying basement membrane (lower). Locations of the tight junction near the lumen (apical) and adherens junction (basolateral) are marked by dashed lines. Right: Disrupted endothelial barrier with focal gaps (red) after exposure to a mediator that increased vascular permeability (upper). Cell connections are maintained by junctions at the tip of finger-like filopodia that extend from one endothelial cell to the adjacent cell (middle). Corresponding TEM of an endothelial gap (lower). Endothelial cells bordering the gap have filopodia on the luminal surface, some with intact intercellular junctions. Extravasated particles of the tracer Monastral blue (black crystals in the center) are trapped in basement membrane exposed by the gap. Basement membrane underlies the endothelial cells and surrounds a pericyte process on the right. TEM images from rat trachea at baseline (left) and after electrical stimulation of vagus nerve for 5 minutes to activate substance P release from sensory axons (right) [131].

