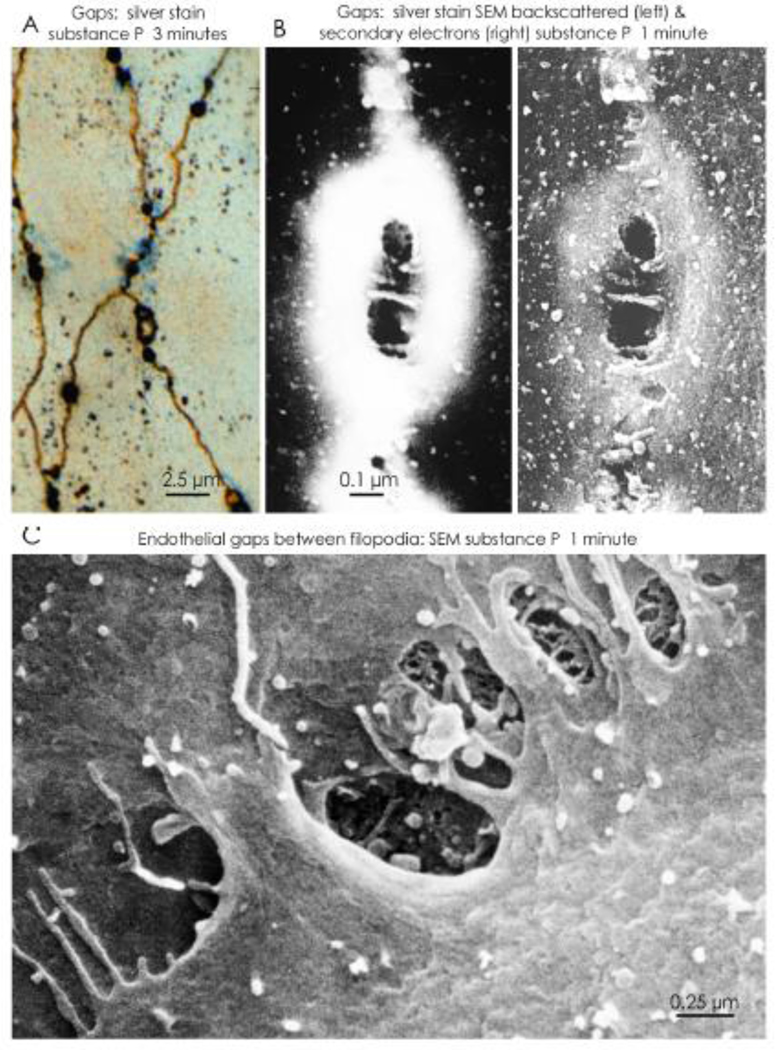
Figure 4. Endothelial gap location and structure.
Distribution and appearance of endothelial gaps in tracheal venules viewed by light microscopy and scanning electron microscopy (SEM) soon after intravenous (iv) injection of the proinflammatory peptide substance P. A. Endothelial gaps are seen as black dots along intercellular junctions (brown lines) in the endothelium of a postcapillary venule stained with silver nitrate 3 minutes after substance P. Leakage of the particulate tracer Monastral blue appears as faint blue staining (from [134]). B. SEM views of endothelial gaps stained with silver nitrate 1 minute after substance P. Silver nitrate appears as a silver annulus (white) around the central gaps (black), which are bridged by endothelial cell filopodia. The gap is visualized by detection of backscattered electrons (left) and secondary electrons (right) (from [136]). C. SEM view of gaps bordered by filopodia at the luminal rim of endothelial cells in a venule 1 minute after iv injection of substance P. Tips of filopodia, reflecting changes in the cortical actin cytoskeleton, maintain contacts between the adjacent endothelial cells. Fibrous basement membrane is visible through some gaps (from [137]).

