Figure 2:
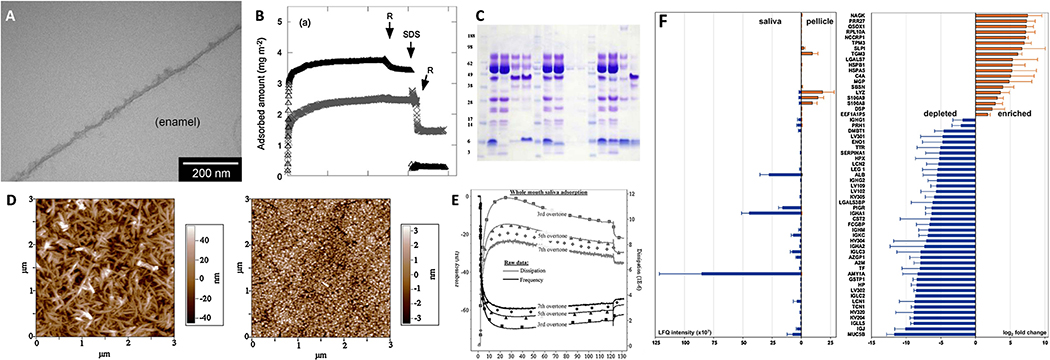
Overview of analytical techniques used to analyze SP formation. A) TEM micrograph of an in situ salivary pellicle formed on enamel after exposure to saliva at 37 °C for 90 min [65]. B) Adsorption kinetics of lactoferrin on hydrophilic silica (Δ) and hydrophobized silica (×) determined via ellipsometry [66]. C) Immunoblot following Coomassie (detects proteins) and periodic acid Schiff stain (detects glycoproteins) of salivary pellicles collected from various surfaces [67]. D) Atomic force micrographs of a hydroxyapatite surface before (left) and after (right) salivary pellicle formation [68]. E) Adsorption kinetics of saliva on hydroxyapatite via QCM-D with raw data and fitted Voigt modelled data [68]. F) Relative abundance of predominant proteins in an SP formed on feldspar ceramic compared to whole saliva using label-free quantitative nano-LC-MS/MS (liquid chromatography-mass spectrometry/mass spectrometry) [69]. All figures were reproduced with permission from the publisher.

