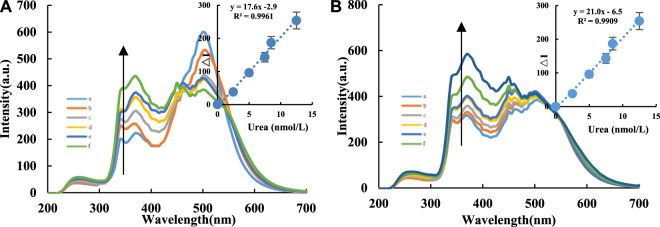
FIGURE 4.
RRS spectra of CD-Tris-HCl-Apt analysis system. A/B compared the RRS analysis system of urea using CDFe and CDFeN, respectively. (A): CDFe-H2O2-TMB-Tris-HCl-Apt-Urea-AgNPs system, a: 0.04 μg/ml CDFe + 6.7 μmol/L H2O2+ 0.03 mmol/L TMB+ 0.84 mmol/L PH = 4.4 Tris-HCl+16.65 nmol/L Apt+0.08 mmol/L AgNPs; b: a+2.5 nmol/L Urea; c: a+5 nmol/L Urea; d: a+7.5 nmol/L Urea; e: a+8.5 nmol/L Urea; f: a+12.5 nmol/L Urea. (B): CDFeN-H2O2-TMB-Tris-HCl-Apt-Urea-AgNPs system, a:0.04 μg/ml CDFeN + 6.7 μmol/L H2O2+ 0.03 mmol/L TMB+ 0.84 mmol/L PH = 4.4 Tris-HCl+16.65 nmol/L Apt+0.08 mmol/L AgNPs; b: a+2.5 nmol/L Urea; c: a+5 nmol/L Urea; d: a+6 nmol/L Urea; e: a+7.5 nmol/L Urea; f: a+10 nmol/L Urea; g: a+12.5 nmol/L Urea.

