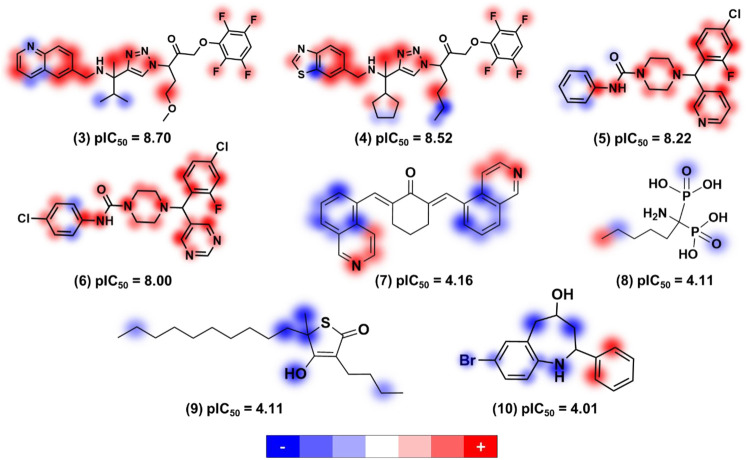
FIGURE 1.
Relevant structural features for trypanocidal activity depicted as contribution maps based on the best kernel based PLS model. Positive, neutral, and negative contributions are depicted in red, white, and blue, respectively, and the color intensity denotes magnitude (de Souza et al., 2019). Creative Commons Attribution (CC BY) license (http://creativecommons.org/licenses/by/4.0/).

