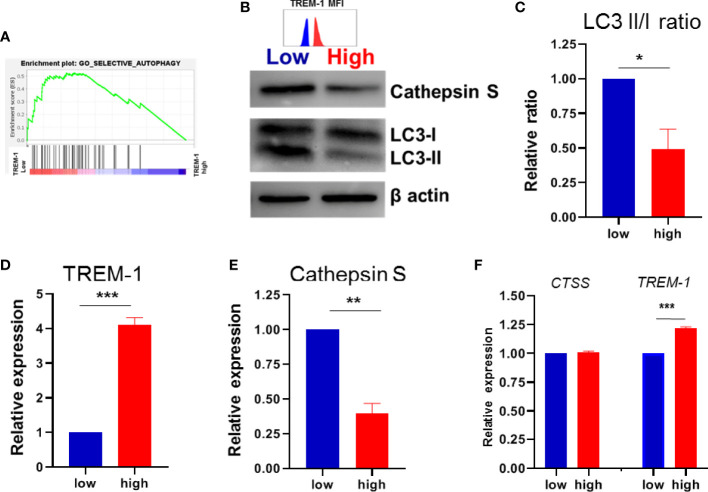
Figure 3.
TREM-1 expression and autophagy. (A) GSEA plot of autophagy in low versus high TREM-1 CD14+ monocytes. (B) Immunoblot for LC3I and LC3II, Cathepsin S and b-actin as a loading control in paired low vs high TREM-1 CD14+ monocytes, representative of 4 different donors. TREM-1 MFI of the sorted populations is indicated above the blot The LC3II/I ratio, Cathepsin S and TREM-1 expression (MFI) were quantified in (C–E) and expressed relative to the low TREM-1 population. (F) CTSS gene and TREM-1 expression from the array. Mean + SEM is shown in (C–F). Significance was determined paired t-tests (C–E) and Wilcoxon signed rank tests in (F) with *P < 0.05, **P < 0.01, ***P < 0.0001.

