Figure 4.
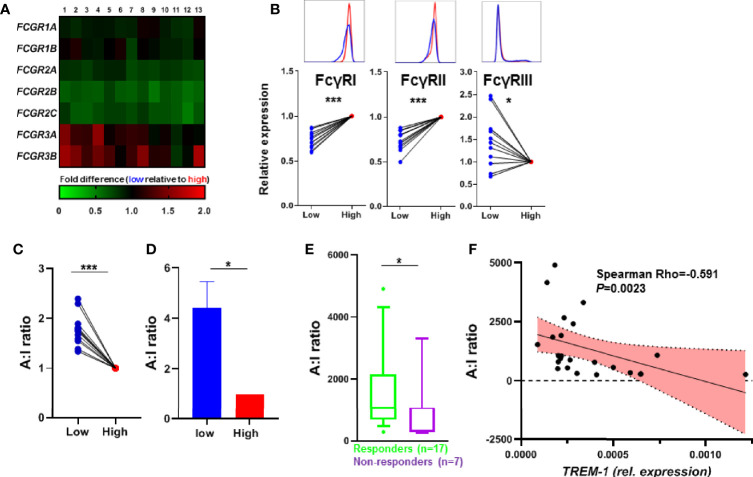
TREM-1 expression and FcγR signaling. (A) Heatmap of the expression of FCGR transcripts, paired expression of the TREM-1 low population relative to the TREM-1 high population of different donors (n=13). (B) The protein levels of FcγRI, FcγRII and FcγRIII were determined by flow cytometry. The MFI was corrected for isotype control on TREM-1 low and high CD14+ gated monocytes and expressed as the TREM-1 low population relative to TREM-1 high for each donor (n=12). (C) The FcγR A:I ratio determined by dividing the FCGR3A expression (activating) by the FCGR2B expression (inhibitory) of (B), as suggested by Castro-Dopico et al. validated by the FcγR A:I ratio determined by FCGR3A and FCGR2B qPCR on the sorted samples from Figure 1D in (D) (n=4). The FcγR A:I ratio of the CD14+ monocytes from CD patients (n=24) before the start of anti-TNF therapy (E) and in correlation to the TREM-1 expression levels (G). Mean + SEM is shown in (D), whiskers indicate the 10-90 percentiles in (F). Significance was determined by Wilcoxon signed rank tests (B, C), a paired t-test (D), and Mann Whitney (E) with *P < 0.05, ***P < 0.001.

