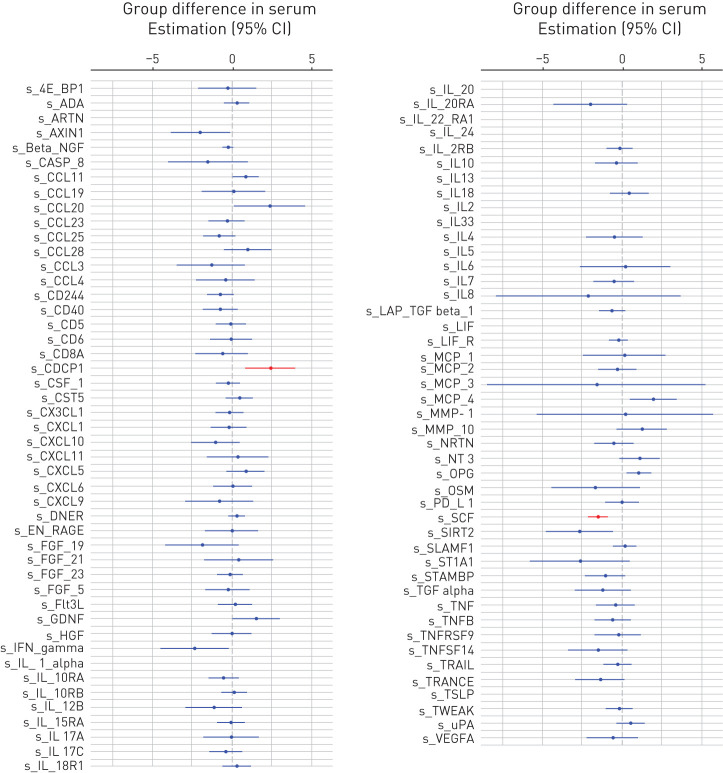
FIGURE 2.
Differences in the expression levels of the 92 investigated proteins between the groups with idiopathic pulmonary fibrosis (IPF) and sarcoidosis expressed as regression coefficient (circle) and 95% confidence interval (line) in serum. Significant differences (false discovery rate-corrected p-values <0.05) are plotted in red. If the confidence interval is on the right side of the dotted line (0) this means that subjects with IPF had higher levels of that protein than subjects with sarcoidosis. The list of the proteins can be found at https://www.olink.com/products/inflammation/

