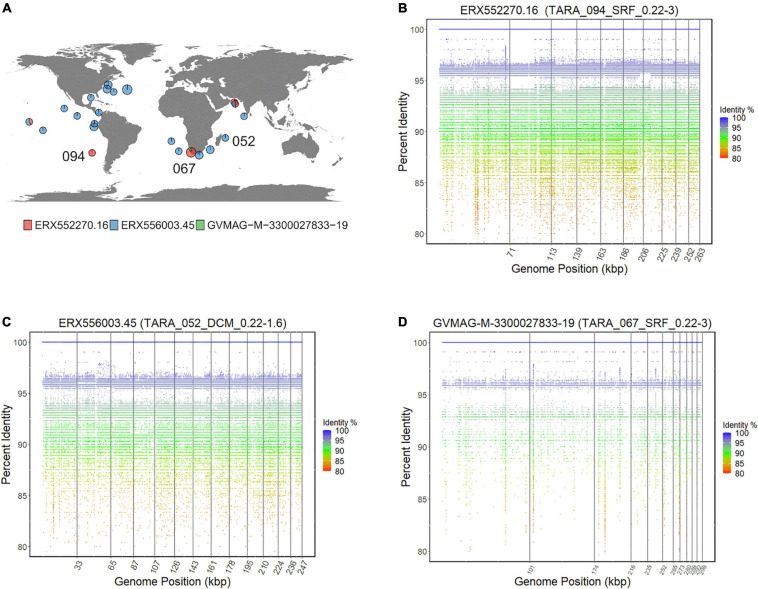
FIGURE 7.
(A) Distribution of Asfarvirus matching metagenomic reads from the TARA ocean project. (B–D) Fragment recruitment plot for metagenomic reads to ERX552270.16, ERX556003.45, and GVMAG-M-3300027833-19, respectively. The x-axis of the recruitment plot shows position of the metagenomic reads along the genome length and y-axis represents the percent identity.

