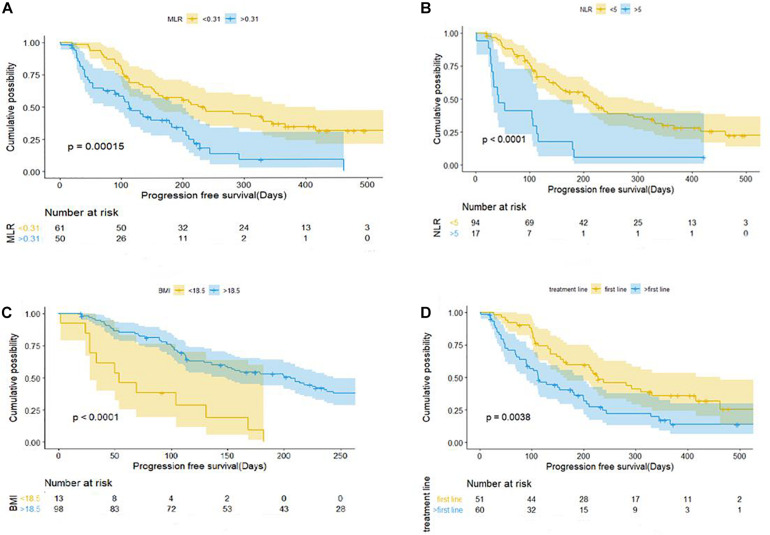
FIGURE 2.
Kaplan–Meier curves of progression-free survival for patients with gastric cancer and colorectal cancer in relation to baseline clinical parameters. (A) MLR. (B) NLR. (C) BMI. (D) Number of treatment lines. BMI, body mass index; MLR, monocyte-to-lymphocyte ratio; NLR, neutrophil-to-lymphocyte ratio.

