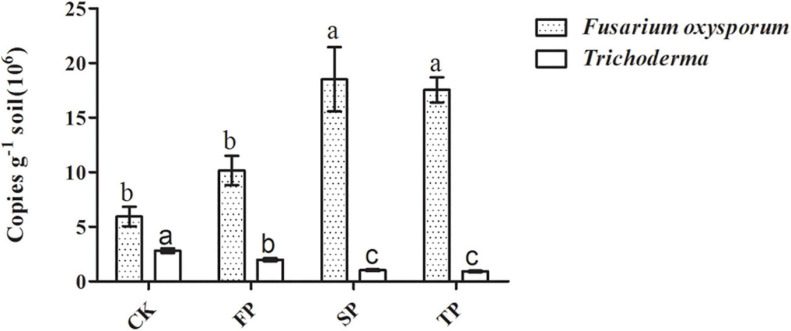
FIGURE 3.
Quantification of Trichoderma spp. and F. oxysporum in the different plots. CK, control with unplanted soil; FP, plot with R. pseudostellariae cultivated in fresh soil; SP, plot with R. pseudostellariae, monocultured for two consecutive years; TP, plot with cultivation of R. pseudostellariae for three consecutive years. Different letters in the same color show significant differences according to least significant difference (LSD) (P ≤ 0.05); data are means ± standard errors (one-way analysis of variance, n = 4).

