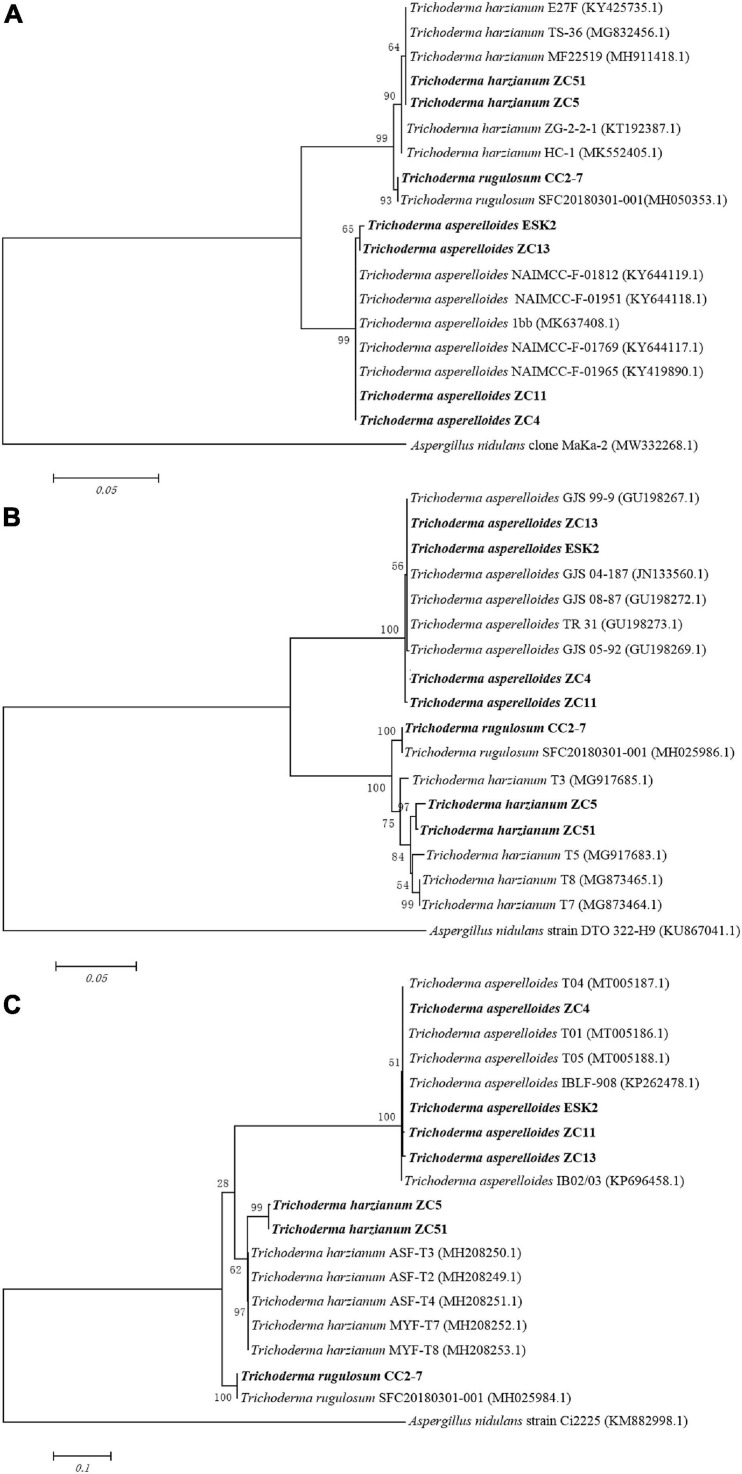
FIGURE 4.
Neighbor-joining tree based on sequence analysis of Trichoderma isolates used in this study. Values of the bootstrap analysis (1,000 repetitions) are given at the nodes. (A) ITS; (B) rpb2; (C) tef1. Aspergillus nidulans was the outgroup. Sequences of biocontrol isolates used for this comparison were obtained from GenBank.

