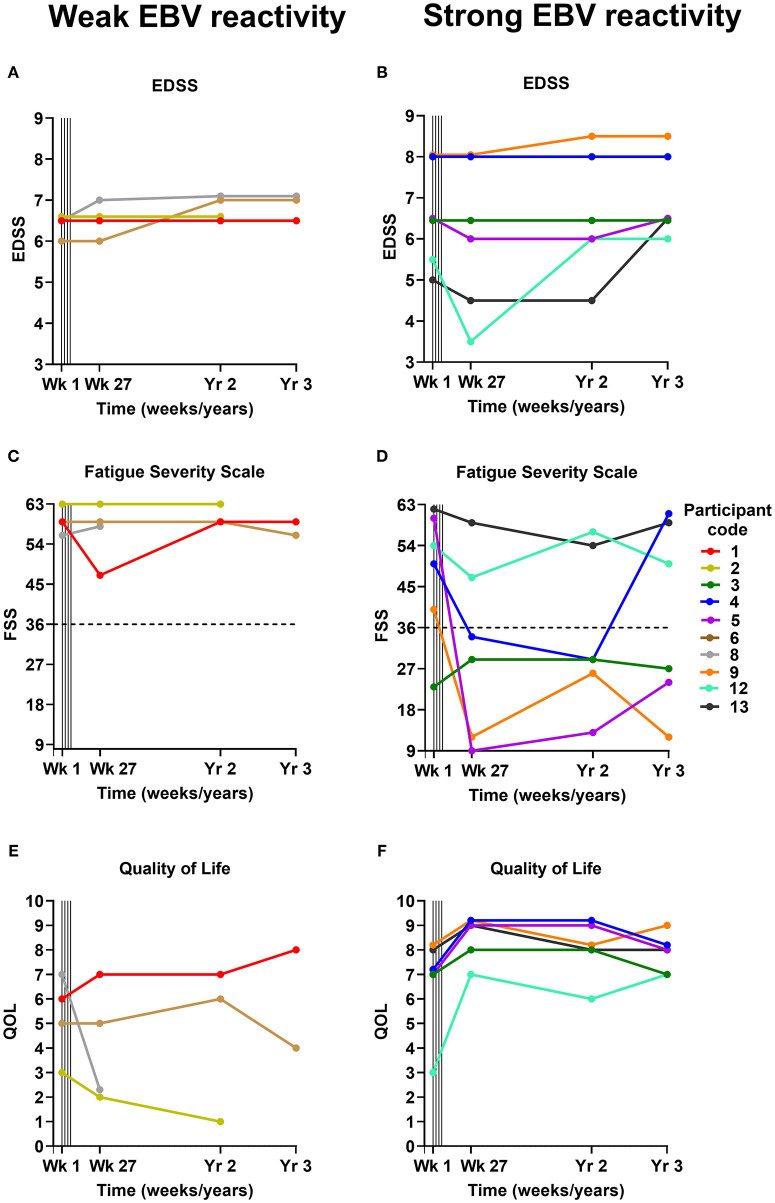
Figure 1.
EDSS (A,B), Fatigue Severity Scale (C,D), and Quality of Life (E,F) scores before and after EBV-specific T cell therapy. The participants are grouped according to whether they received a T cell product with weak EBV reactivity (<5% of CD8+ T cells reacting to EBV) (A,C,E) or strong EBV reactivity (>5% of CD8+ T cells reacting to EBV) (B,D,F). For the Fatigue Severity Scale (C,D) a total score of 36 (indicated by dotted horizontal lines) or more suggests that a person is suffering from fatigue; the maximum score is 63 and the minimum score is 9. Vertical lines indicate successive T cell infusions of 5 × 10⁶, 1 × 10⁷, 1.5 × 10⁷, and 2 × 10⁷ cells at 2-week intervals from week 1 to 7. EDSS, Expanded Disability Status Scale; FSS, Fatigue Severity Scale; QOL, Quality of Life; EBV, Epstein–Barr virus; Wk, week; Yr, year.

