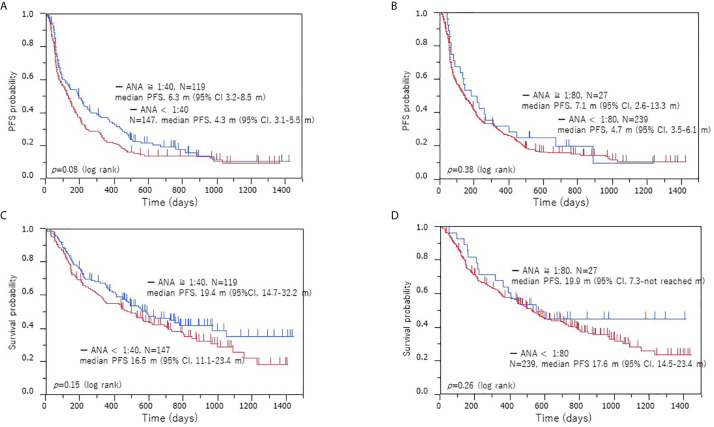
Figure 2.
Kaplan–Meier survival curves of PFS and OS according to ANA positivity in the low and high cohorts. PFS (A) and OS (B) when a positive ANA cutoff of 1:40 was used, PFS (C) and OS (D) when a positive ANA cutoff of 1:80 was used. Survival analysis with ICI treatment: no significant difference in the PFS and OS was observed between the ANA-positive and ANA-negative patients or high and low ANA titer cohorts. PFS, progression-free survival; OS, overall survival; ANA, anti-nuclear antibody.

