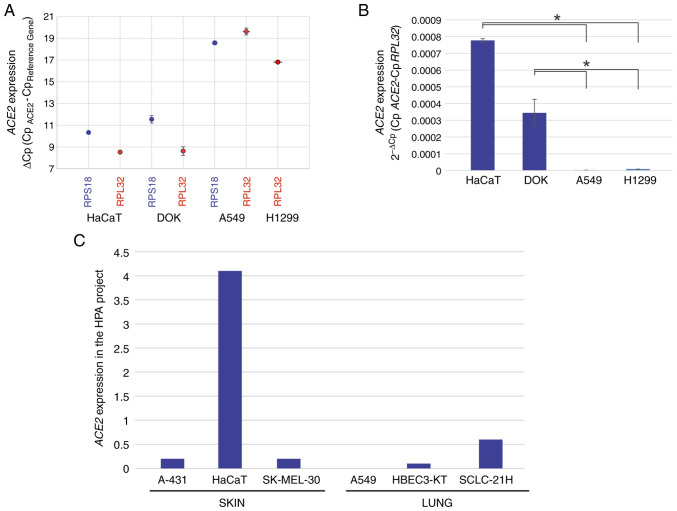
Figure 1.
Reverse transcription-quantitative PCR was performed to analyze expression of ACE2 in oral-, skin-, and lung-derived epithelial cells. (A) ACE2 expression in HaCaT (skin), DOK (oral) and A549 and H1299 (lung) cells was calculated as ΔCp (values inversely proportional to expression) or (B) calculated using the 2-ΔCp algorithm (mRNA quantity values). The values are presented as the mean ± SD from at least three different experiments, with RPL32 and RPS18 serving as reference genes. *P<0.05. (C) ACE2 expression in skin- and lung-derived epithelial cells using data from the HPA project. The values represent an estimation of the abundance of ACE2 transcripts in each cell line. Data are derived from RNA-seq experiments and a value of 1.0 is defined as the threshold for ACE2 expression at the protein level. ACE2, angiotensin-converting enzyme 2; HPA, Human Protein Atlas.

