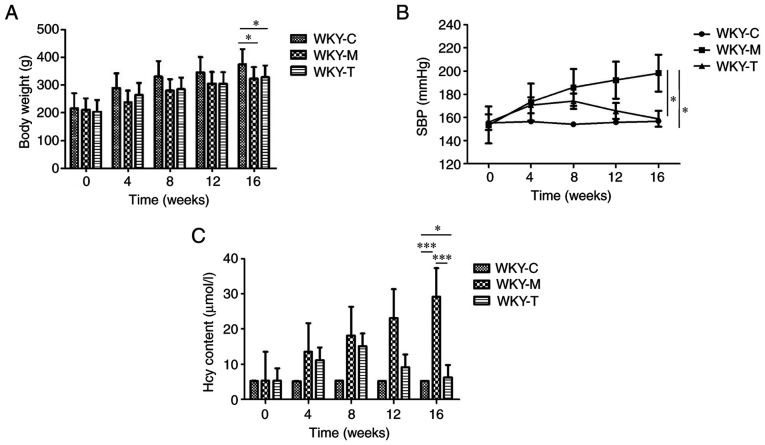
Figure 1.
Physical examination and detection of plasma Hcy content. (A) Body weight, (B) SBP and (C) plasma Hcy content changes over the 16 weeks in each group. Data are presented as the mean ± standard error of the mean. *P<0.05 and ***P<0.001 as indicated. SBP, systolic blood pressure; Hcy, homocysteine; C, control; M, methionine; T, treatment; WKY, Wistar-Kyoto.

