Figure 6.
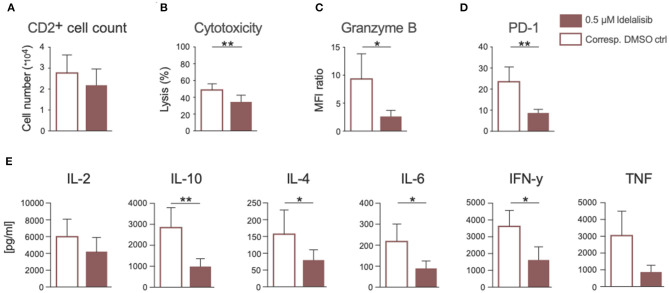
Inhibition of PI3K∂ by idelalisib impairs cytotoxicity and cytokine secretion of T cells isolated from CLL patient samples. (A) Compiled data showing the percentage of proliferated CD2+ T cells in the presence or absence of idelalisib (n = 15). (B) Cytolytic capacity of CD3+ T cells in coculture with target HL−60 cell line and idelalisib after 72 h. (C,D) Bar charts depicting expression levels of granzyme B and PD-1 in T cells after 72 h coculture with HL-60 cells in the presence of idelalisib or DMSO (n = 6). (E) Bar charts representing the levels of IL-2, IL-10, IL-4, IL-6, TNF, and IFNγ in the supernatant of the coculture after 72 h in the presence or absence of idelalisib (n = 15). Error bars represent mean ± SEM; *p ≤ 0.05, **p ≤ 0.005.

