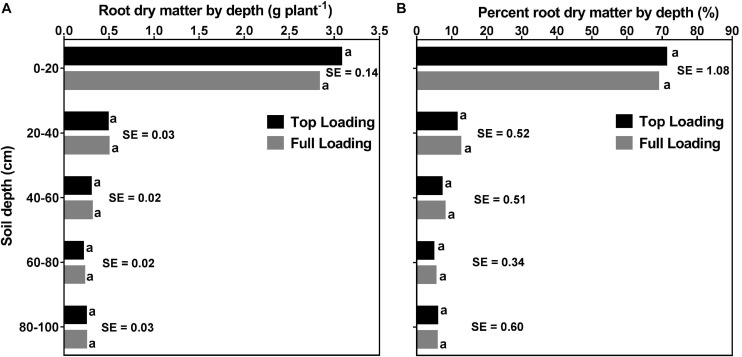
FIGURE 8.
Effects of fertilizer placement and soil depth on root dry matter distribution (A; left) and percent root dry matter distribution (B; right) for soybean grown in a greenhouse in 1-m rooting columns. Fertilizer placement treatments are top loading or full loading. Data are from a harvest measurement made at physiological maturity (120 days after planting). Each data point at each soil profile depth represents fertilizer placement treatment (averaged across three watering treatments) least square mean values ± 1 S.E. Within a soil depth, fertilizer least-square means followed by the same letter are not significantly different (p ≥ 0.05) according to a Tukey’s test. Five replicates were used.

