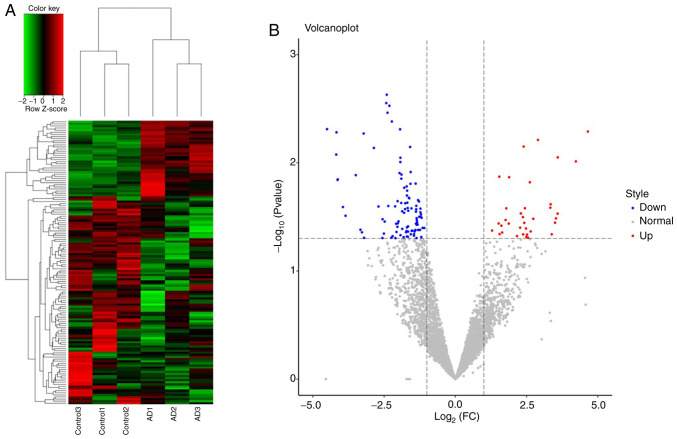
Figure 1.
(A) Hierarchical clustering of differentially expressed tRFs between the AD (n=3) and control groups (n=3). The colour scale represents high (red) to medium (black) to low (green) relative expression. (B) Volcano plot displaying the differentially expressed tRFs displaying significantly upregulated tRFs (red), significantly downregulated tRFs (blue) and nonsignificant tRFs (grey). AD, atopic dermatitis; tRFs, transfer RNA-derived fragments; FC, fold change.

