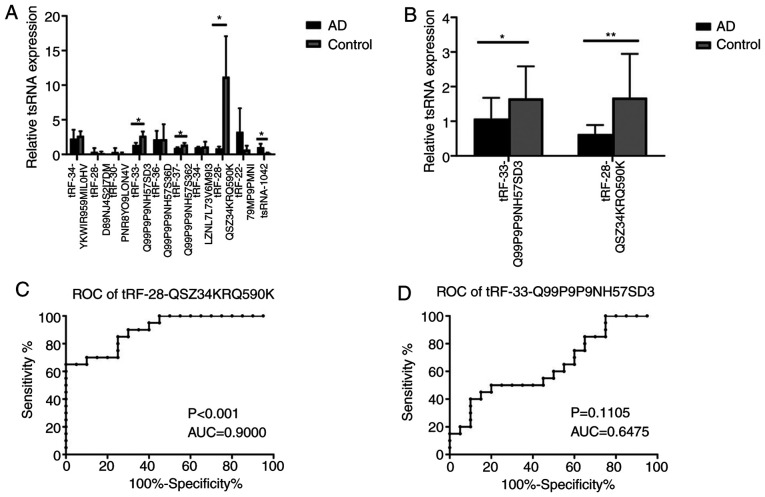
Figure 3.
Verification of tRFs and ROC curve analysis. (A) Verification of 10 tRFs in 3 subjects with AD and 3 controls by RT-qPCR. (B) Verification of 2 tRFs in 20 patients with AD and 20 controls by RT-qPCR. *P<0.05; **P<0.01. (C and D) ROC curve analysis of (C) tRF-28-QSZ34KRQ590K and (D) tRF-33-Q99P9P9NH57SD3 for the differentiation of subjects with AD from the controls. tRFs, transfer RNA-derived fragments; AD, atopic dermatitis; RT-qPCR, reverse transcription-quantitative PCR; ROC, receiver operating characteristic; AUC, area under the ROC curve.

