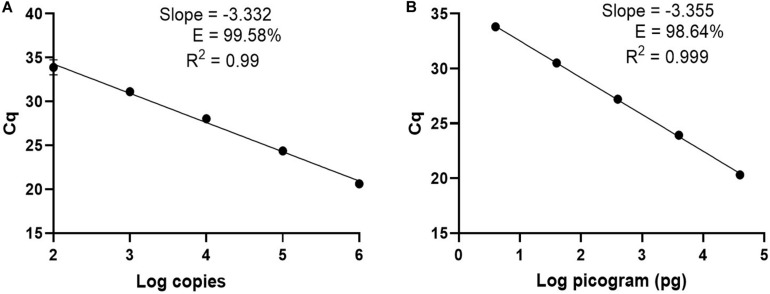
FIGURE 3.
The Ter-qPCR against serial dilutions of the Ter-plasmid and B. burgdorferi B31 DNA to measure the LoD and PCR efficiency: (A) Ter-plasmid and (B) B31 DNA. Cq values were plotted against the log values of serial dilutions of the Ter-plasmid and B31 DNA, respectively. Simple regression analysis was carried out using the Graphpad Prism 8.4.3 software. The slope, coefficient of correlation (R2) and efficiency of the reaction (E) are shown. Each dot represents the average value from triplicate amplifications, along with the SD.

