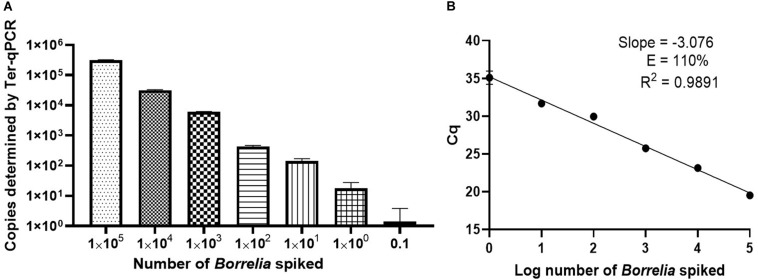
FIGURE 4.
Performance of the Ter-qPCR estimated by examining human blood spiked with tenfold serial dilutions of Borrelia cells (105 to 0.1). (A): bar graph illustrating the number of spike-in Borrelia cells and the resulting copy numbers determined by the Ter-qPCR; (B): Linear regression analysis between the known amount of spiked Borrelia cells and the resulting Cq values revealed a strong linear association. The slope, coefficient of correlation (R2) and efficiency of the reaction (E) are shown. Each dot represents the average value from triplicate repeats along with SD values obtained from two independent experiments.

