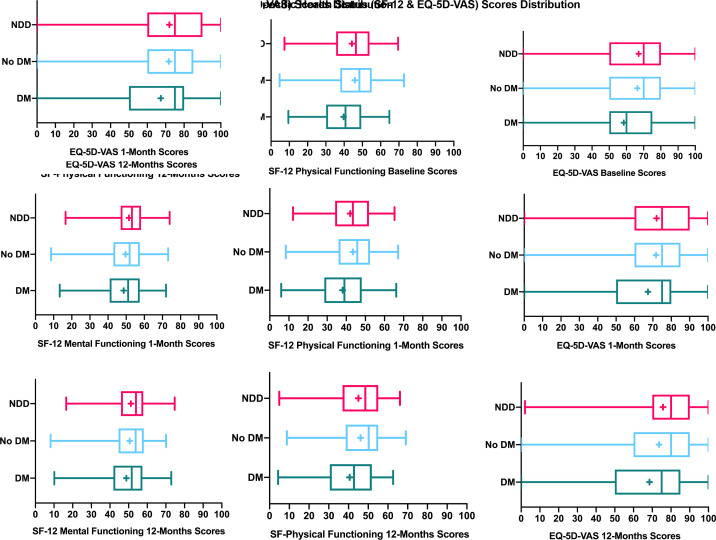
Figure 3.
Non-disease-specific health status scores distribution over time after AMI in young adults, stratified by diabetes status. AMI, acute myocardial infarction; DM, established diabetes; NDD, newly diagnosed diabetes; box plot showing mean score (+), median score (line within the box), interquartile range box, and the minimum and maximum score values (the ends of the whiskers).

