
Figure 1.
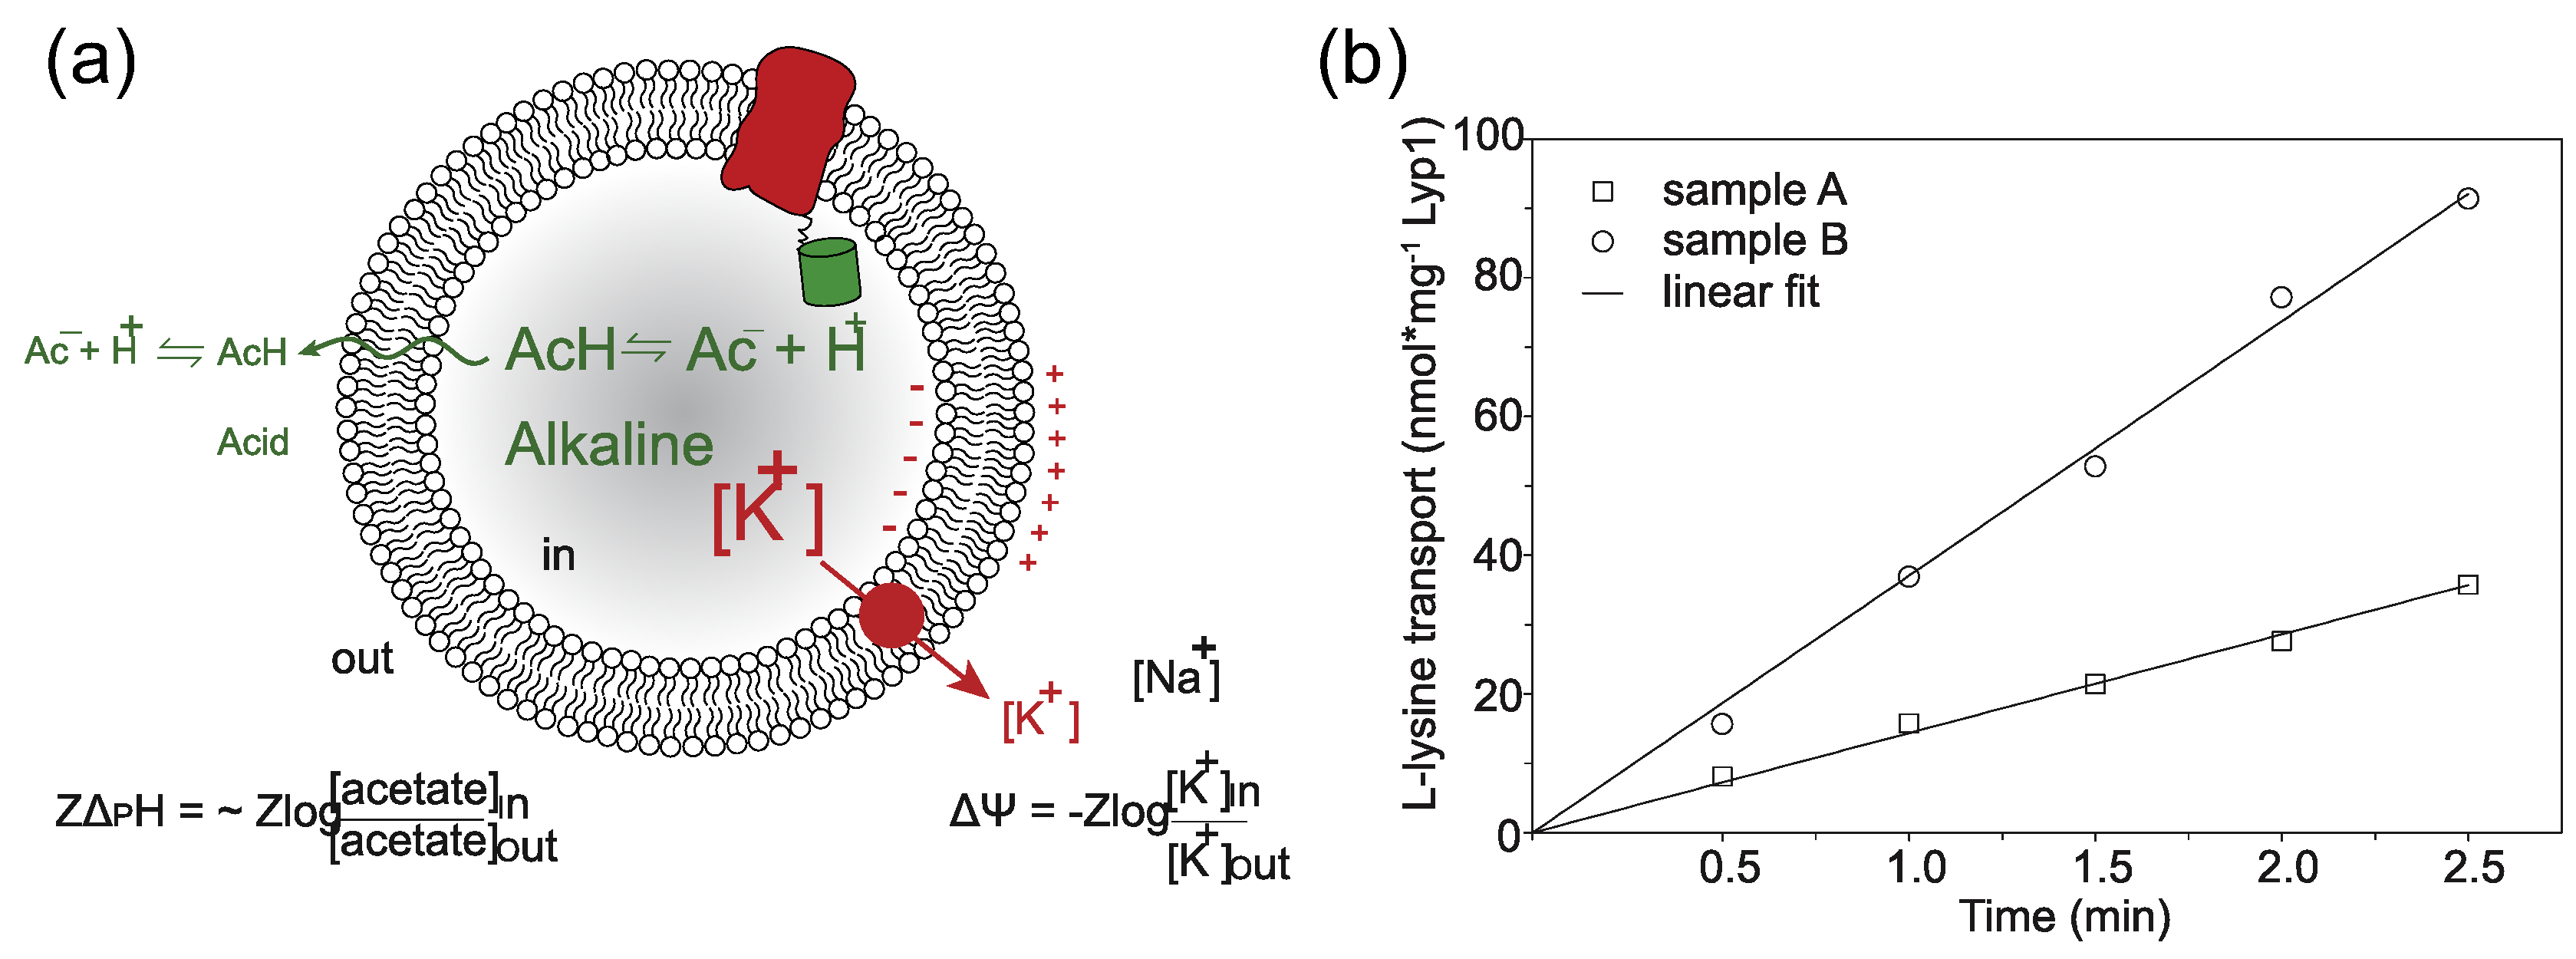
Generation of proton motive force and lysine transport progress curves. (a) Schematic showing the generation of a membrane potential (ΔΨ, red arrow) by a valinomycin-mediated potassium diffusion potential and pH gradient (ΔpH, green) via an acetate diffusion potential. Together the ΔΨ and ΔpH form the proton motive force (PMF = ΔΨ − ZΔpH, where Z equals 2.3RT/F and R and F are the gas and Faraday constant, respectively, and T is the absolute temperature. (b) Transport of lysine by Lyp1-GFP-containing proteoliposomes and data fitting. Lyp1 activity is obtained from the slopes of such lines and the rates of transport are converted into turnover numbers. (a) and (b) indicate two independent samples, i.e. two different lipid compositions