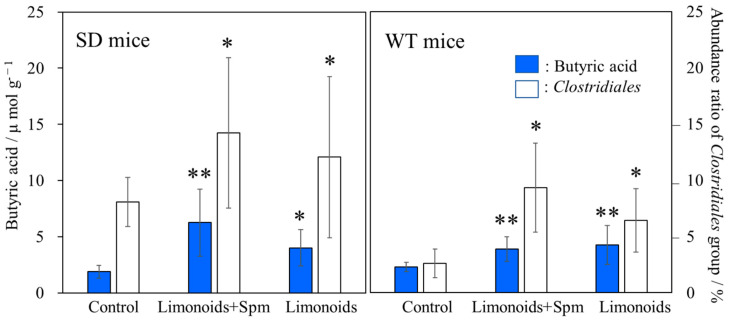
Figure 8.
Comparison of the amount of butyric acid in feces from SD or WT mice (μmol g−1) and relative abundance (%) of bacteria (Clostridiales groups) identified from Figure 7 as promoting butyric acid metabolism. Values represent mean ± S.D. Data onto a bar graph are plotted in comparison to the controls for clarity; * p ≤ 0.05; ** p ≤ 0.01. The correlation coefficient between the relative abundance (%) of the Clostridiales groups and the amount of butyric acid, r = 0.72, p < 0.01. SD, Sandhoff disease; WT, wild-type.

