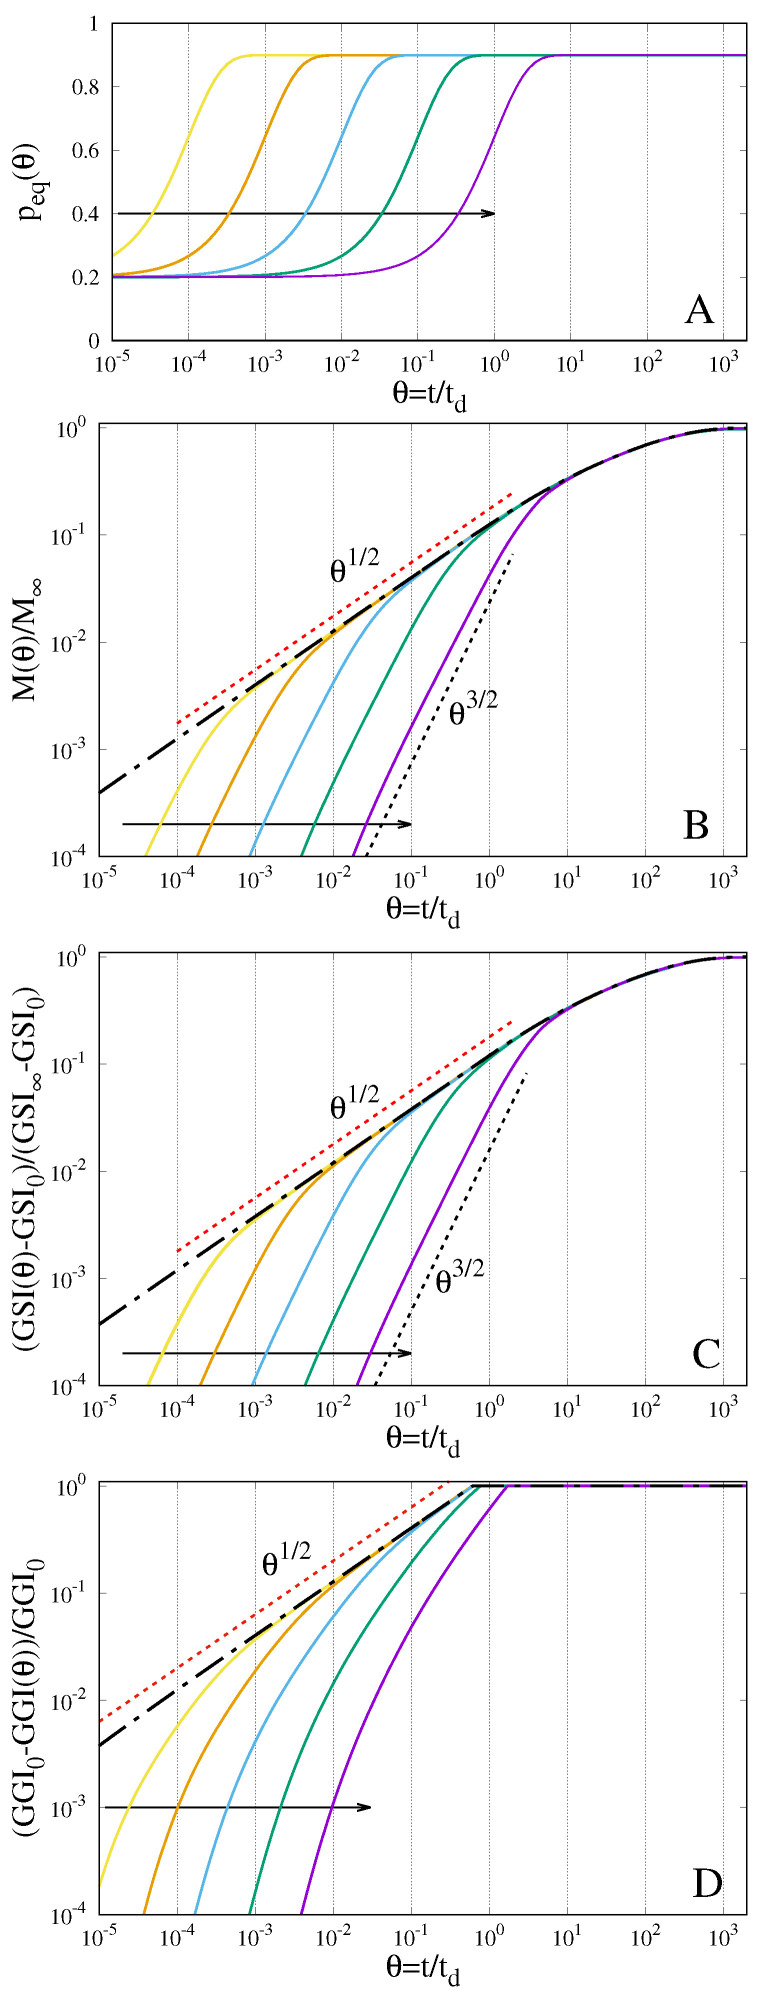
Figure 3.
Temporal evolution of the boundary solvent volume fraction (A), the normalized amount of absorbed solvent (B), the rescaled Gel–Solvent interface (C) and the rescaled Glass–Gel interface (D). Arrows indicate increasing values of . Dot-dashed black lines represent the behaviour of the parabolic transport scheme, representing the limiting case .

