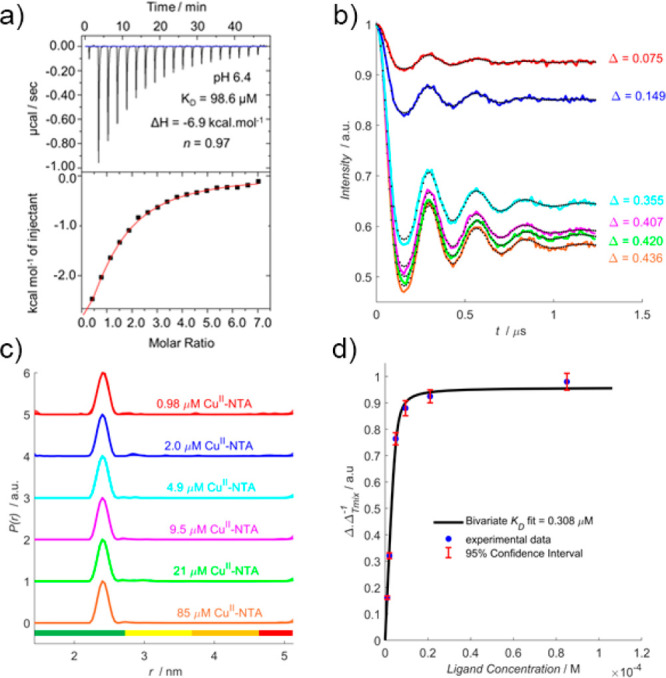
Figure 3.

pH 6.4 RIDME pseudotitration. (a) ITC data performed at 298 K, 75 μM K28H/Q32H GB1 titrated against 2 mM CuII–NTA. (b) RIDME dipolar evolution functions, with the corresponding fits shown in dotted black. Modulation depths (Δ) are indicated. (c) Validated RIDME distance distributions, corresponding to the dipolar evolution functions shown in (b). The color scheme is the same in (b) and (c). The concentrations of CuII–NTA are indicated. (d) A bivariate fit of the dissociation constant (0.31 μM) is shown in solid black. Experimental points are shown as the blue scatter, and 95% confidence intervals are shown as the red error bars.
