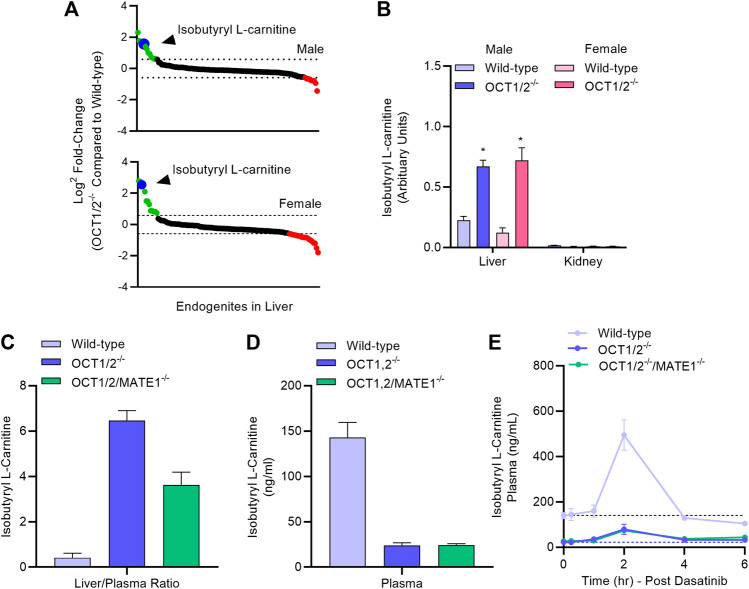
FIGURE 4.
Targeted metabolomics and endogenous OCT1 biomarker identification. (A) Differentially quantitated endogenous metabolites (“endogenites”) in the liver of male and female wild-type mice and OCT1/2-deficient mice. Endogenites highlighted in green and red were significantly increased and decreased, respectively in livers of OCT1/2-deficient mice. The blue symbol represents isobutyryl L-carnitine (IBC). (B) Liver and kidney concentrations of IBC in wild-type and OCT1/2-deficient mice (n = 5). (C,D) Liver-to-plasma ratio and plasma level of IBC at baseline in wild-type mice, OCT1/2-deficient mice, and OCT1/2/MATE1-deficient mice (n = 5). (E) Plasma concentration-time profile of IBC in wild-type mice, OCT1/2-deficient mice, and OCT1/2/MATE1-deficient mice (n = 5) after a single oral dose of dasatinib (15 mg/kg). *p < 0.05 vs. wild-type. All values represent mean ± SEM.

