Figure 3.
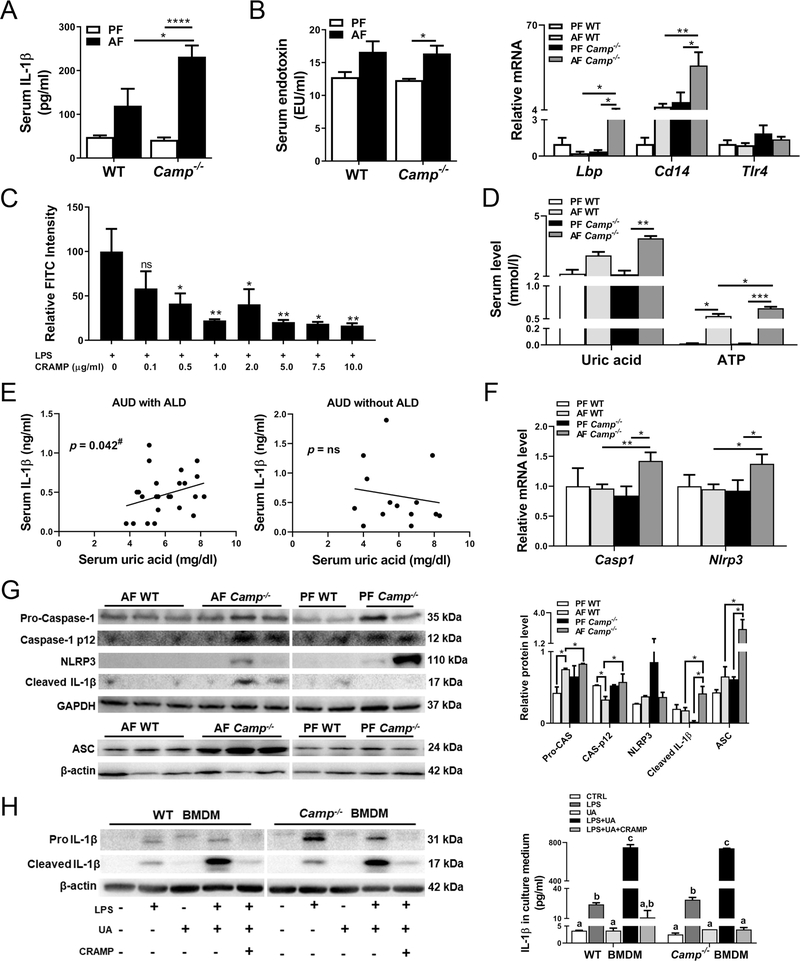
CRAMP is involved in alcohol-induced IL-1β production and inflammasome activation. (A) Serum concentrations of IL-1β. (B) Serum endotoxin levels (left panel) and hepatic mRNA levels of Lbp, Cd14, and Tlr4 (right panel). (C) LPS binding activity shown as FITC intensity of FITC-conjugated LPS-treated RAW264.7 cells. LPS-FITC: 1 μg/ml. Asterisks indicate the significant difference comparing LPS alone and treated groups. (D) Serum uric acid (UA) and ATP levels. Data are expressed as mean SEM (n = 8–10). (E) Correlation of serum levels of UA and IL-1β in AUD patients. #Covaried with LBP. Univariate and multivariate regression model was used (n = 14–26). (F) Hepatic mRNA levels of Casp1 and Nlrp3. (G) Representative bands of immunoblotting quantification of molecules in inflammasome activation in liver lysates. Data are expressed as mean SEM (n = 8–10). (H) Left panel: Representative bands of immunoblotting quantification of pro-IL-1β and cleaved IL-1β protein in BMDM lysates. The bands are composite images of selected bands, and the corresponding β-actin controls are shown. Right panel: IL-1β protein levels in culture media of BMDMs. Data are expressed as mean SEM (n = 4–6).

