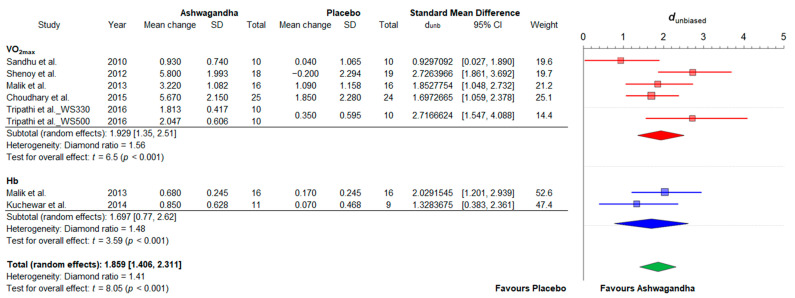
Figure 6.
Forest plot depicting the standardized mean differences from the meta-analysis of studies comparing groups with Ashwagandha or placebo on cardiorespiratory fitness. Colored squares represent the dunb for individual trials, while colored and green polygons depict the meta-analytic dunb for the indicated subgroups and for the overall (total) results, respectively. Horizontal lines represent the 95% confidence intervals for the data. Hb: blood hemoglobin concentration; VO2max: maximum oxygen uptake; WS330: Withania somnifera 330 mg; WS500: Withania somnifera 500 mg.

