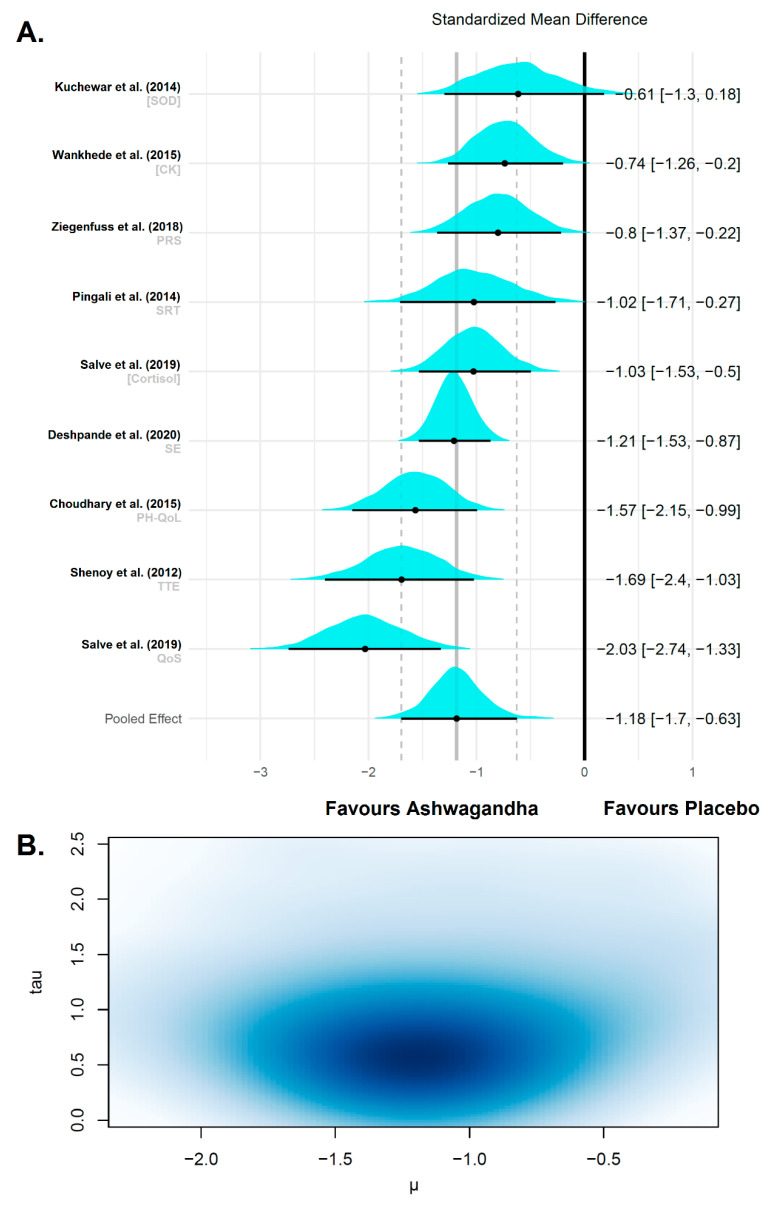
Figure 9.
Forest plot of a random effect meta-analysis on fatigue/recovery variables after Ashwagandha supplementation. (A) The plot shows the names of the studies with their respective variable or multiple comparison/multiple outcomes on the left. On the right are the θk and 95% CrI. The value of the overall weighted mean of effect sizes is drawn as a vertical line in the middle of the plot, which represents the reference line to test the null hypothesis in each study. The posterior distributions of the estimated effect sizes for each study are shown as cyan densities. The black circle represents the posterior mean, and the horizontal line extending from the point is the 95% CrI. The bottom row is the meta-analytic effect size (µ). (B) Multivariate kernel density estimation plot of the posterior distribution of μ (x-axis) and τ (y-axis) with the darker zone indicating increased plausibility of values.

