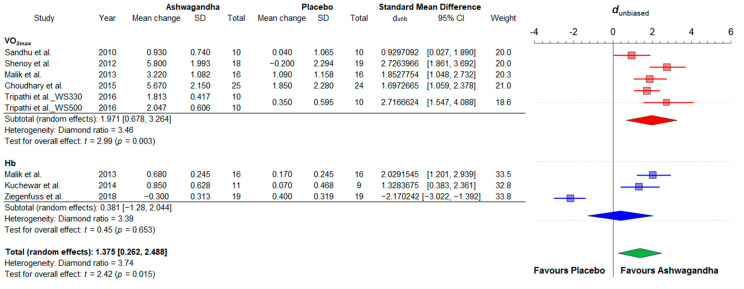
Figure A1.
Forest plot depicting the standardized mean differences from a meta-analysis of all studies (including outliers) comparing groups with Ashwagandha or placebo on cardiorespiratory fitness. Colored squares represent the dunb for individual trials, while colored and green polygons depict the meta-analytic dunb for the indicated subgroups and for the overall (total) results, respectively. Horizontal lines represent the 95% confidence intervals for the data. Hb: blood hemoglobin concentration; VO2max: maximum oxygen uptake; WS330: Withania somnifera 330 mg; WS500: Withania somnifera 500 mg.

