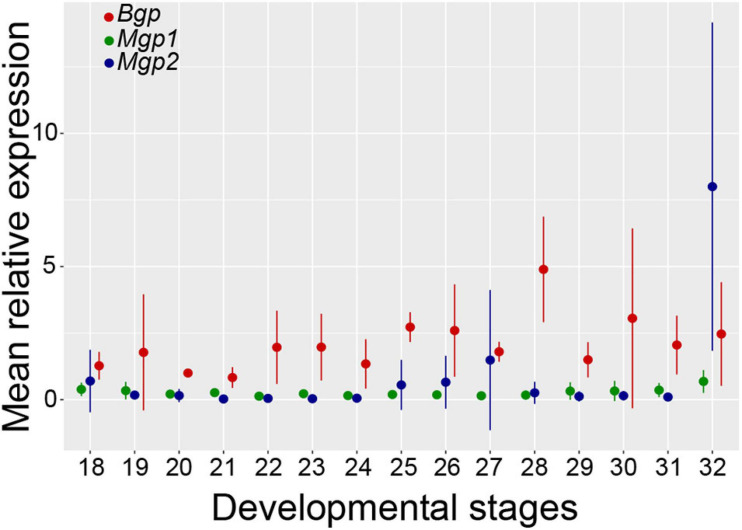
FIGURE 8.
Relative levels of Mgp1, Mgp2, and Bgp mRNA expression in early embryos of the small-spotted catshark (stage 18–32). The value set to 1 was chosen as the Bgp mean value at stage 20; for each gene, at each developmental stage, mean values are represented with standard deviation. At each point, 3 < n < 4.

