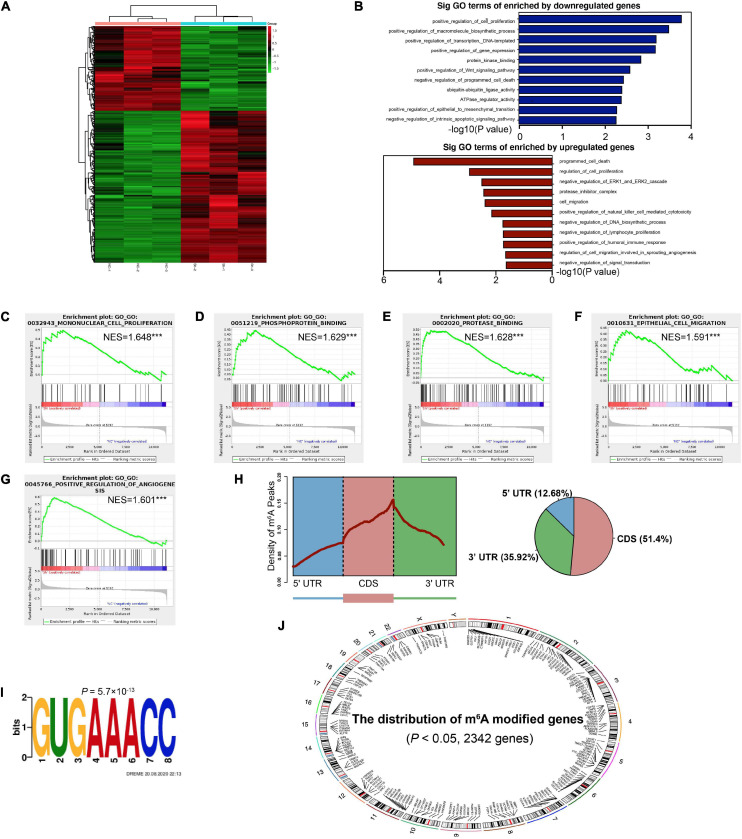
FIGURE 4.
Identification of the YTHDF1 targets in GC cells. (A) Heatmap of DEGs identified by RNA-seq. (B) GO enrichment analysis of DEGs. (C–G) GSEA plots showing the pathways of DEGs enriched by YTHDF1 were involved in GC cells. (H) Metagene profiles of m6A enrichment across mRNA transcriptome in BGC-823 cells. (I) The m6A motif detected by the DREME motif analysis with m6A-seq results. (J) The distribution of m6A peaks on different chromosomes. DEGs, differentially expressed genes; GC, gastric cancer; GO, Gene ontology; GSEA, gene set enrichment analysis. ***P < 0.001.

