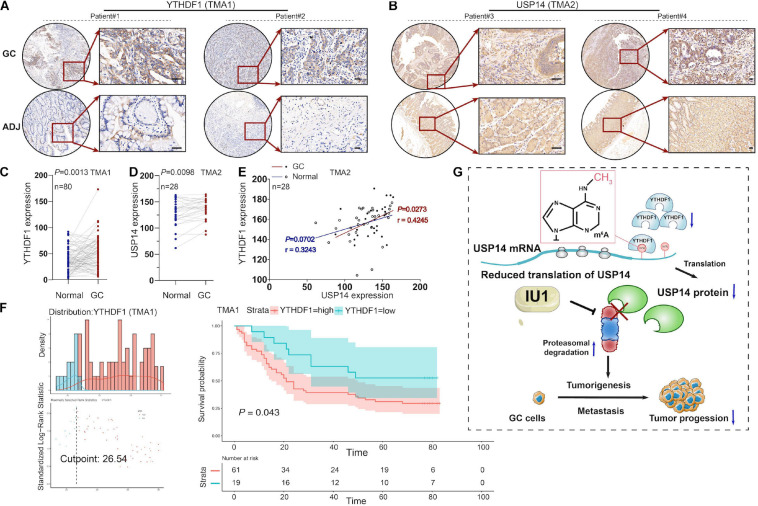
FIGURE 7.
The correlation between YTHDF1 and USP14 expression in GC patients. (A) Representative immunohistochemical images of YTHDF1 expression in primary gastric tumor tissues and normal gastric gland. Scale bar, 50 μm. (B) Relative USP14 protein expression in normal gastric gland and GC specimens assessed by immunohistochemistry in TMA2 (n = 28). Scale bar, 50 μm. (C) Comparison between protein expression of YTHDF1 in patients with GC and their adjacent normal tissues according to TMA1 dataset (n = 80). (D) Comparison between protein expression of USP14 in patients with GC and their adjacent normal tissues according to TMA2 dataset (n = 28). (E) The correlation analysis of the protein expressions of YTHDF1 and USP14 in GC samples and their adjacent normal tissues (n = 28; Pearson’s and spearman’s correlation test). (F) Kaplan-Meier analysis of GC patients in TMA1 dataset (n = 80) for the correlations between YTHDF1 expression and overall survival. (G) Proposed model underlying the roles of YTHDF1-mediated USP14 translation in GC. GC, gastric cancer; TMA, tissue microarray; Data are shown as means ± S.D.

