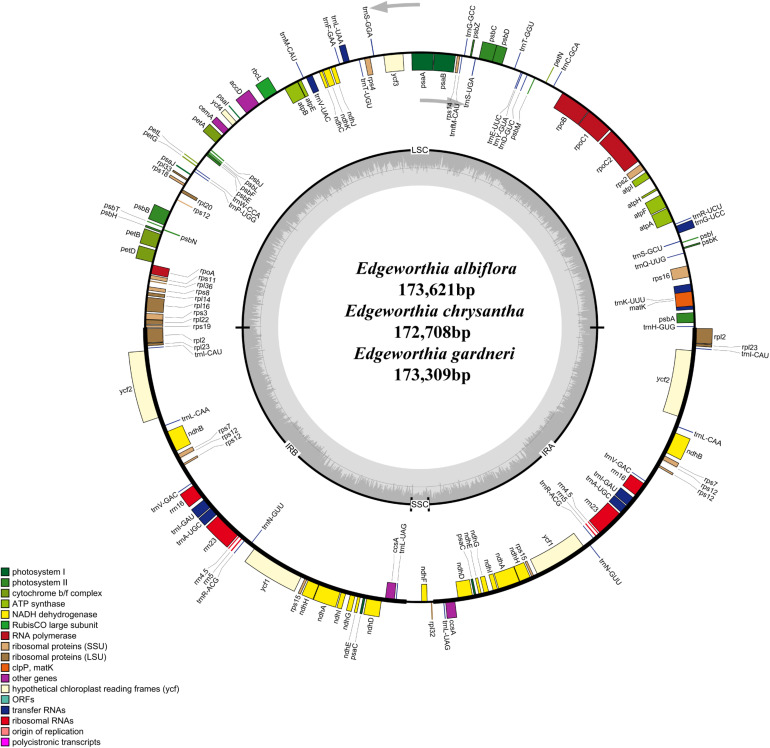
FIGURE 1.
Gene map for chloroplast genomes of three species of Edgeworthia. Annotated genes are colored according to functional categories. Genes placed outside the outer circle were transcribed clockwise; genes placed inside the circle were transcribed counterclockwise. Dark gray in inner circle represents GC content whereas light gray corresponds to AT content.

