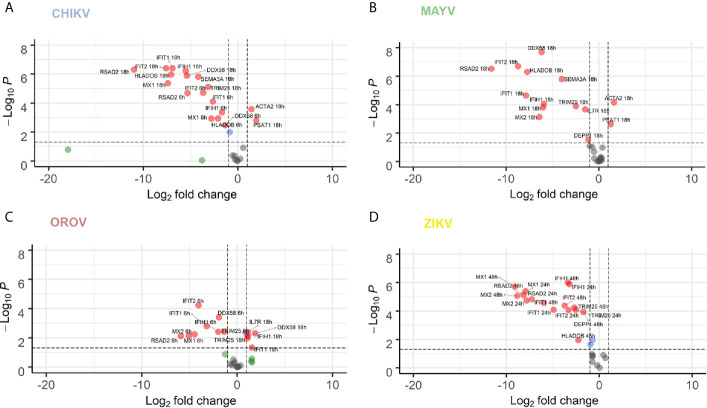
Figure 6.
RT-qPCR validation of 16 selected DEGs co-modulated by CHIKV, MAYV, OROV, and ZIKV. hAST cells were infected with MOI 1 of CHIKV (A), MAYV (B), OROV (C) at 6 and 18 hpi and ZIKV (D) at 24 and 48 hpi and RT-qPCR was performed at indicated time points and compared to uninfected cells (n = 3 for each time point and condition). Data denotes p-values (y-axis) and mean fold change (x-axis) of infected cells relative to uninfected cells for 16 DEGs selected from commonly modulated genes in RNA-Seq dataset. Gene expression was normalized by endogenous HPRT1 levels. Red dots represent DEGs with at least 1 log2 Fold Change and P value ≤ 0.05. Blue dots represent DEGs with only P value ≤ 0.05. Green dots represent DEGs with at least 1 log2 Fold Change. Grey dots represent non-significant DEGs.

