Figure 4.
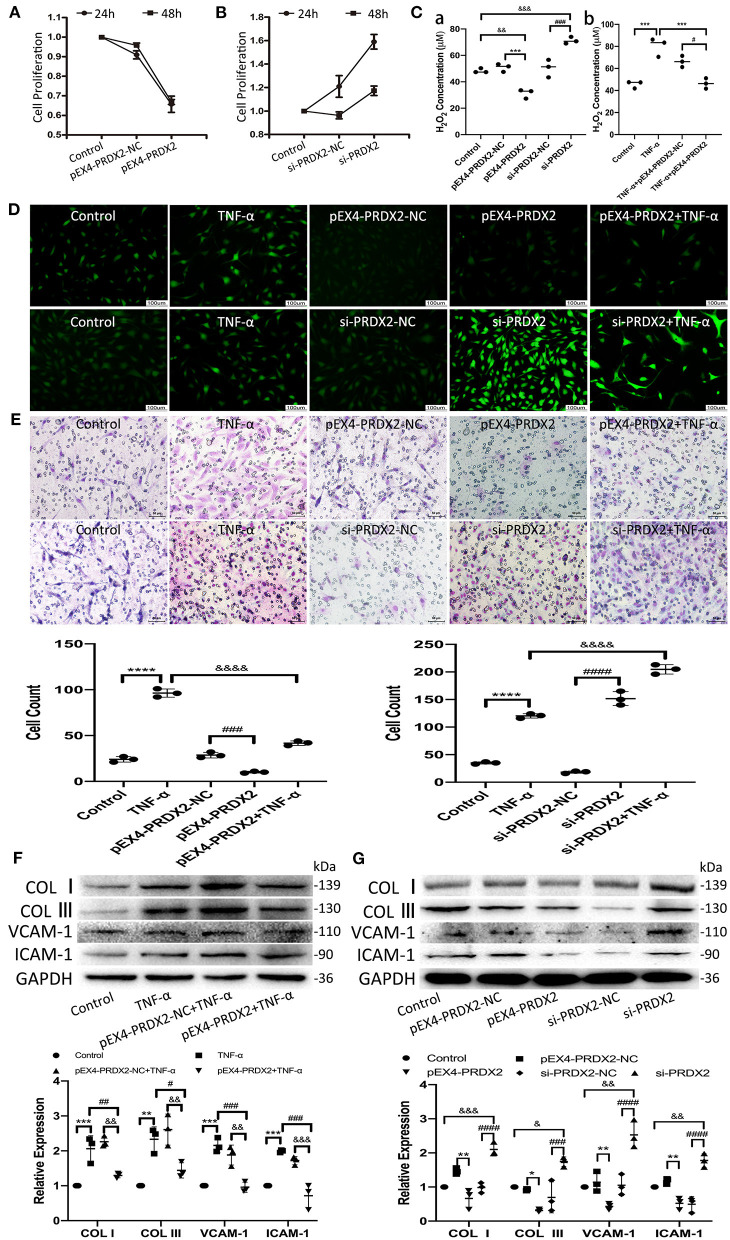
PRDX2 attenuates ROS and potentially protects against the development of AS. (A,B) CCK-8 assay was applied to evaluate endogenously expressed PRDX2 on the proliferation of the CAVSMCs. (C) The H2O2 concentration on pEX4-PRDX2 and si-PRDX2 transfection CAVSMCs and TNF-α treatment to evaluate the effect of PRDX2 in inhibiting ROS [(a) &&p < 0.01 and &&&p < 0.001 vs. control group, ***p < 0.001 vs. pEX4-PRDX2-NC group, ###p < 0.001 vs. si-PRDX2-NC group. (b) ***p < 0.001 vs. TNF-α group and #p < 0.05 vs. TNF-α+pEX4-PRDX2-NC group]. (D) Representative immunofluorescence pictures of ROS (green). Scale bar: 100 μm. (E) Transwell assay was used on TNF-α treatment, pEX4-PRDX2, and si-PRDX2 transfection CAVSMCs to evaluate the migration effect of PRDX2 (****p < 0.0001 vs. control group, ###p < 0.001 and ####p < 0.0001 vs. respective NC group, &&&&p < 0.0001 vs. TNF-α group). (F) Western blot and semi-quantitative analyses for COL I, COL III, VCAM-1, and ICAM-1 expression in pEX4-PRDX2-CAVSMCs treated with TNF-α (**p < 0.01 and ***p < 0.001 vs. control group, #p < 0.05, ##p < 0.01, and ###p < 0.001 vs. TNF-α group, &&p < 0.01 and &&&p < 0.001 vs. pEX4-PRDX2-NC+TNF-α group). (G) Western blot and semi-quantitative analyses for COL I, COL III, VCAM-1, and ICAM-1 expression in the CAVSMCs treated with pEX4-PRDX2 and si-PRDX2 transfection (*p < 0.05 and **p < 0.01 vs. pEX4-PRDX2-NC group, ###p < 0.001 and ####p < 0.0001 vs. respective si-PRDX2-NC group, &p < 0.05, &&p < 0.01, and &&&p < 0.001 vs. control group). GAPDH was used as an endogenous control. The data were obtained from three independent experiments.

