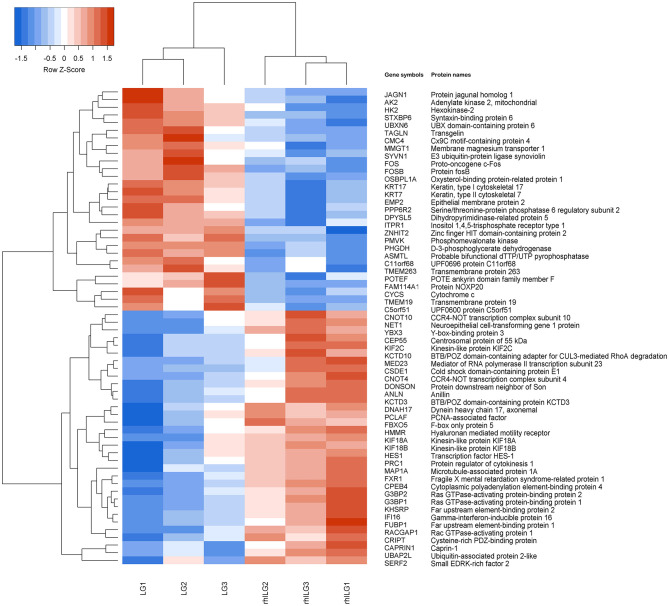
Figure 2.
Hierarchical clustering of the differentially expressed proteins in SaOS-2 osteosarcoma cells between the LG and rhILG. Each group contains three samples. The heatmap is a visualized demonstration of the protein distribution in different samples. The red color represents upregulation, and the blue color represents downregulation. The upper dendrogram illustrates the clustering analysis of different samples in different groups, and the left dendrogram shows the clustering analysis of different proteins in different samples. A total of 62 proteins were significantly changed between the LG and rhILG, including 33 upregulated proteins and 29 downregulated proteins (p < 0.05).

