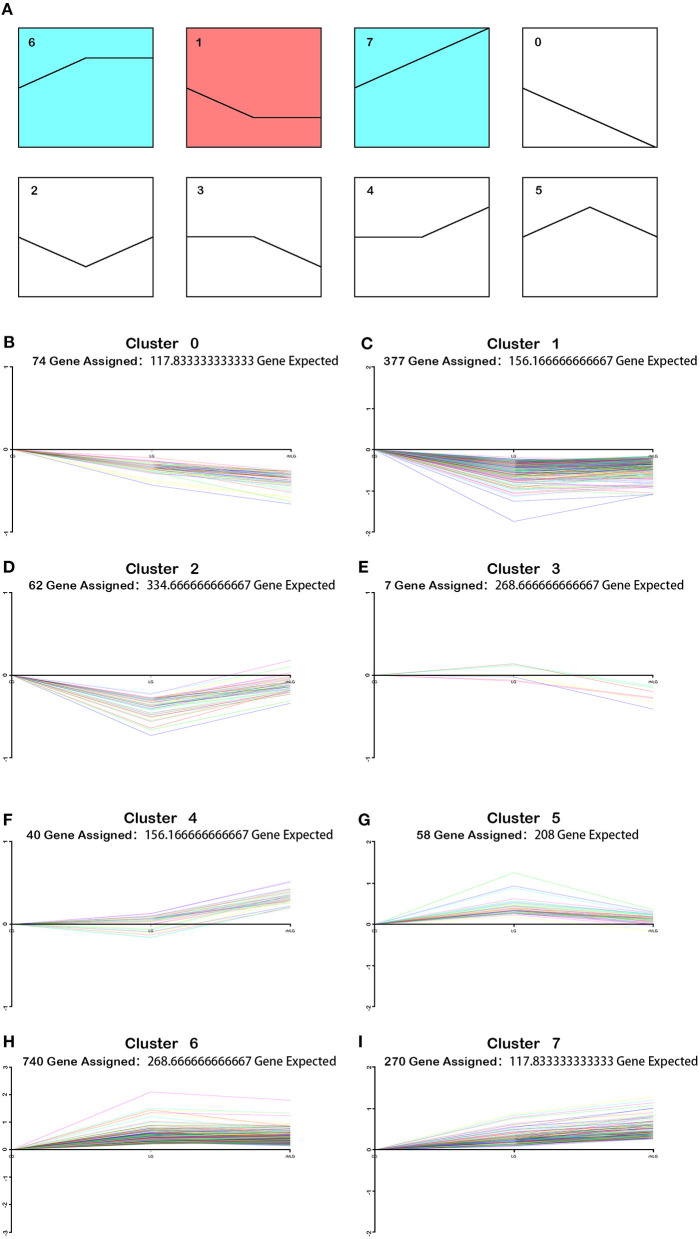
Figure 4.
Varied trends of differentially expressed proteins between the rhILG and LG using Short Time-series Expression Miner (STEM). (A) Proteins were grouped into eight clusters from 0 to 7. Clusters of similar colors represent similar trends. (B–I) Specific trends of different clusters; each line represents a different protein. (B) Seventy-four proteins were contained in cluster 0, in which proteins decreased in the LG compared with in the CG and decreased in the rhILG compared with the LG. (C) A total of 377 proteins were contained in cluster 1, in which proteins decreased in the LG compared with in the CG and slightly increased in the rhILG compared with in the LG. (D) Sixty-two proteins were contained in cluster 2, in which proteins decreased dramatically in the LG compared with in the CG and increased sharply in the rhILG compared with in the LG. (E) Seven proteins are contained in cluster 3, in which proteins increase or decrease slightly in the LG compared with in the CG and decrease sharply in the rhILG compared with in the LG. (F) Forty proteins were contained in cluster 4, in which proteins increase or decrease slightly in the LG compared with the CG and increase sharply in the rhILG compared with in the LG. (G) Fifty-eight proteins were contained in cluster 5, in which proteins increased sharply in the LG compared with in the CG and decreased dramatically in the rhILG compared with in the LG. (H) A total of 740 proteins were contained in cluster 6, in which proteins increased sharply in the LG compared with in the CG and showed no obvious changes in the rhILG compared with in the LG. (I) A total of 270 proteins were contained in cluster 7, in which proteins increased in the LG compared with in the CG and increased in the rhILG compared with in the LG.

