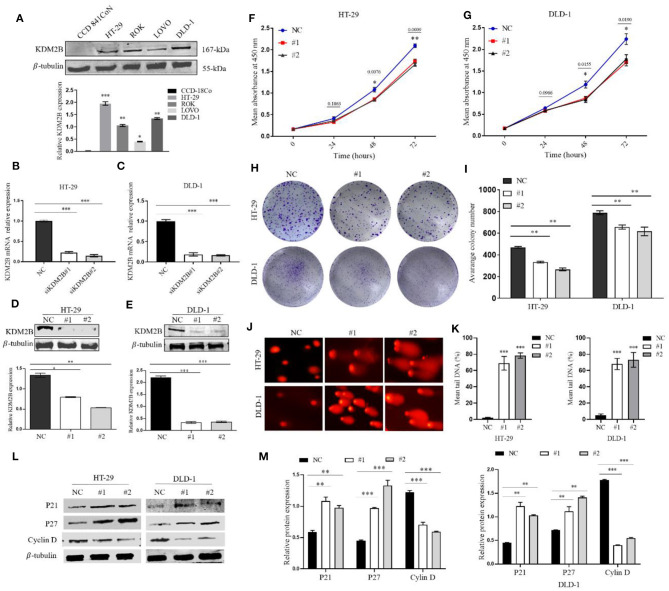
Figure 2.
KDM2B restrains cell proliferation in CRC and induces DNA damage. (A) KDM2B protein was analyzed by Western blotting in the indicated normal human colon epithelial cells (CCD841CoN) and CRC cell lines (HT-29, ROK, LOVO, and DLD-1) *p < 0.05, **p < 0.01, ***p < 0.001. (B,C) HT-29 and DLD-1 were transfected with siRNA (siKDM2B #1 and siKDM2B #2) and negative control (NC) using lipofectamine 2000. The relative expression of KDM2B mRNA was examined by real-time qRT-PCR after normalizing to GAPDH (n = 3), ***p < 0.001. (D,E) The assessment of the expression level of KDM2B protein and the bar chart of quantified KDM2B protein expression in transfected HT-29 and DLD-1 cells. Data are presented as Mean ± SEM (n = 3). Statistical significant differences in mRNA and protein in cells were observed (*p < 0.05, **p < 0.01, ***p < 0.001 vs. negative control). The results of the CCK-8 assay (F,G) demonstrated that cell viability decreased in HT-29 and DLD-1 cells after KDM2B knockdown *p < 0.05, **p < 0.01 vs. control. (H,I) HT-29 and DLD-1 cell colonies formed and graphical presentation of the average of colonies formed in control (NC) and transfected groups (#1 and #2). Data are expressed as Mean ± SEM (n = 3). **p < 0.01. (J) Comet images from HT-29 and DLD-1 cells after knockdown of KDM2B. The transfected cell group shows increasing levels of damage compared with the negative control. The number of cells scored in each measured concentration was 50. (K) The bar chart of the mean tail comet in percentage *** p < 0.001. (L) Representative densities of P21, P27, Cyclin D, and β-Tubulin proteins after Western blot experiment. (M) Cluster bar charts of representative proteins **p < 0.01, ***P < 0.001.

