Figure 7.
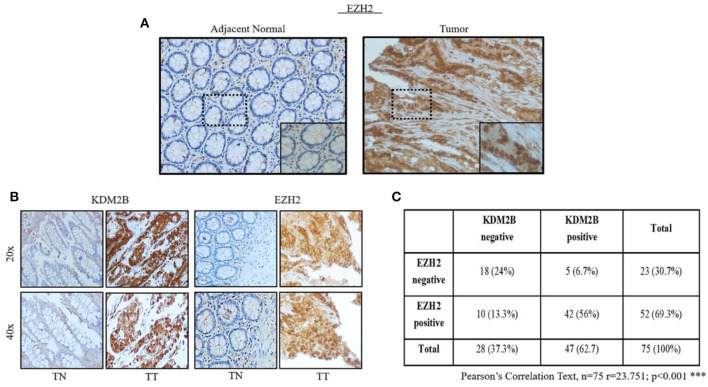
The expressions of EZH2 is positively related to KDM2B in tissues with CRC. (A) Representative images of the expression of EZH2 in adjacent normal tissue specimens with CRC vs. tumor tissue. (B) The expression of KDM2B and EZH2B proteins in TMA tissue sections was represented by the cohort. The magnification was × 20 and × 40, respectively. Scale bar = 100 μm. (C) The negative correlation of KDM2B with the expression of EZH2 was assessed using the chi-square Pearson correlation text (n = 75; r = 23,751; ***p < 0.001).

