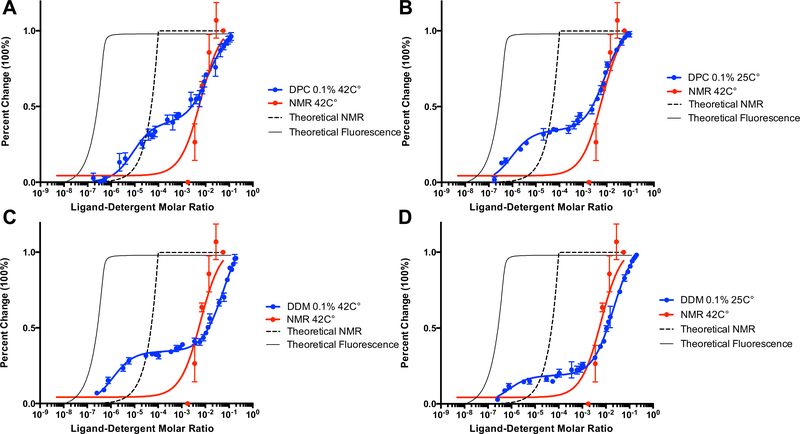
Fig. 2.
Characterization of PK11195 binding to mTSPO under different detergent and temperature conditions by intrinsic tryptophan fluorescence. The x-axis is plotted as log of the ligand-detergent molar ratio and the y-axis is plotted as percent maximal change to allow for direct comparison between datasets from different techniques. The NMR titration curve for PK11195 performed at 42 °C in the presence of 2% w/v DPC is plotted in all panels for comparison against fluorescence data. The theoretical titration curve of the reported binding affinity in the literature for binding of PK11195 to mTSPO is also plotted for both fluorescence (solid line) and NMR (dashed line). A Fluorescence quenching of mTSPO by PK11195 in 0.1% (w/v) DPC at 42 °C. B Fluorescence quenching of mTSPO by PK11195 in 0.1% (w/v) DPC at 25 °C. C Fluorescence quenching of mTSPO by PK11195 in 0.1% (w/v) DDM at 42 °C. D Fluorescence quenching of mTSPO by PK11195 in 0.1% (w/v) DDM at 25 °C. The average and standard deviations are represented as points and bars, respectively, and reflect at least three independent experiments

